In JGCRI/rfasst: rfasst
knitr::opts_chunk$set(
  collapse = TRUE,
  comment = "#>"
)
The functions in this module estimate adverse health effects attributable to fine particulate matter (PM2.5) and ozone (O3; M6M) exposure, measured as premature mortalities, years of life lost (YLLs), and disability adjusted life years (DALYs). The following code shows as an example, the functions to estimate premature mortalities attributable to PM2.5 and the DALYs associated with ozone exposure (M6M).All the functions associated to this module can be found in the References page.
library(rfasst)
library(magrittr)

 db_path<-"path_to_your_gcam_database"
 query_path<-"path_to_your_gcam_queries_file"
 db_name<-"name of the database"
 prj_name<-"name for a Project to add extracted results to" # (any name should work, avoid spaces just in case)
 scen_name<-"name of the GCAM scenario",
 queries<-"Name of the query file" # (the package includes a default query file that includes all the queries required in every function in the packae, "queries_rfasst.xml")


  # To write the csv files into the output folder:

     m3_get_mort_pm25(db_path,query_path,db_name,prj_name,scen_name,queries,saveOutput=T, map=F)

     m3_get_daly_o3(db_path,query_path,db_name,prj_name,scen_name,queries,saveOutput=T, map=F)

  # To save this data by TM5-FASST region in year 2050 as dataframes:

     pm25.mort.2050<-dplyr::bind_rows(m3_get_mort_pm25(db_path,query_path,db_name,prj_name,scen_name,queries,saveOutput=F, map=F)) %>% dplyr::filter(year==2050)
     head(pm25.mort.2050)

     o3.daly.2050<-dplyr::bind_rows(m3_get_daly_o3(db_path,query_path,db_name,prj_name,scen_name,queries,saveOutput=F, map=F)) %>% dplyr::filter(year==2050)
     head(o3.daly.2050)
The calculation of premature mortalities is consistent with the Global Burden of Disease 2016 (Lim et al). Mortalities are estimated for five causes, namely stroke, ischemic heart disease (IHD), chronic obstructive pulmonary disease (COPD), acute lower respiratory illness diseases (ALRI) and lung cancer (LC). As explained in the TM5-FASST documentation paper (Van Dingenen et al 2018), cause-specific deaths are estimated following the following equation:
$$Mort_{t,r,c,j}=mo_{r,c,j} \cdot ((RR_{c,j}-1)/RR_{c,j})\cdot Pop_{t,r}$$
So premature mortality in period $t$, region $r$, for cause $c$, associated with exposure to pollutant $j$ is calculated as the product between the baseline mortality rate, the change in the RR relative risk of death attributable to a change in population-weighted mean pollutant concentration, and the population exposed.
-
Cause-specific baseline mortality rates are taken from the World Health Organization projections WHO 2013.
-
For PM2.5, relative risk are estimated based on the Integrated Exposure-Response functions (ERFs) from Burnett et al 2014. For O3, relative risk is based on the ERFs from Jerret et al 2009.
-
Population exposed is cause-specific. We assume that for all the causes adults are exposed (>30 Years) while for ALRI, children under 5 years. Population fractions are calculated from the from the SSP database.
Years of life lost and DALYs are estimated by transforming premature mortalities into either YLLs or DALYs using constant ratios. YLL-to-Mortalities ratios are based on a reduction in statistical life expectancy (months) per 10µg/m³ increase in anthropogenic PM2.5 (TM5-FASST calculations). DALY-to-Mortalities ratios are estimated using the latest available data on mortailities and DALYs from the Institute for Health Metrics and Evaluation (IHME). We note that these ratios (both for YLLs and for DALYs) are calculated regionally so they differ across regions.
Economic damages associated to the health impacts are calculated multiplying either the premature mortalities or the years of life lost by the corresponding Value of Statistical Life (VSL) or Value of Statistical Life Year (VSLY). Both the VSL and the VSLY are based on the widely accepted OECD values for 2005. According to the literature, this value ranges between US$1.8 and $4.5 million for VSL. The calculations for all regions are based on the “unit value transfer approach” which adjusts the VSL according to their GDP and GDP growth rates, as detialed in Narain and Sall 2016. In this version, we assume the income elasticity of both the VSL and the VSLY are equal to 0.8, with no adjustments across regions. A potential regional adjustment of these income elasticities will be explored in further developments of the package. We note that the central OECD values could be adjusted by the user. Finally, the damages reported by the functions use the median values of VSL and VSLY for simplicity. The reporting of Lower and Upper Bounds can be selected by the user, but requires some code changes. The systematic reporting of LB and UB is planned for the next package development.
The following code shows some examples for the monetized premature deaths associated to exposure to PM2.5 and monetized years of life lost attributable to O3 exposure:
library(rfasst)
library(magrittr)

 db_path<-"path_to_your_gcam_database"
 query_path<-"path_to_your_gcam_queries_file"
 db_name<-"name of the database"
 prj_name<-" Name for a Project to add extracted results to" # (any name should work, avoid spaces just in case)
 scen_name<-"Name of the GCAM scenario"
 queries<-"Name of the query file" # (the package includes a default query file that includes all the queries required in every function in the packae, "queries_rfasst.xml")

  # To write the csv files into the output folder:

     m3_get_mort_o3_ecoloss(db_path,query_path,db_name,prj_name,scen_name,queries,saveOutput=T, map=F)

     m3_get_yll_o3_Ecoloss(db_path,query_path,db_name,prj_name,scen_name,queries,saveOutput=T, map=F)

  # To save this data by TM5-FASST region in year 2050 as dataframes:

     pm25.mort.ecoloss.2050<-dplyr::bind_rows(m3_get_mort_o3_ecoloss(db_path,query_path,db_name,prj_name,scen_name,queries,saveOutput=F)) %>% dplyr::filter(year==2050)
     head(pm25.mort.ecoloss.2050)

     o3.yll.ecoloss.2050<-dplyr::bind_rows(m3_get_yll_o3_Ecoloss(db_path,query_path,db_name,prj_name,scen_name,queries,saveOutput=F)) %>% dplyr::filter(year==2050)
     head(o3.yll.ecoloss.2050)
The complete list of outputs generated by the suite of functions that form this module is listed below:
PM25_MORT_[scenario]_[year].csvPM25_YLL_[scenario]_[year].csvPM25_DALY_[scenario]_[year].csvPM25_MORT_ECOLOSS_[scenario]_[year].csvPM25_YLL_ECOLOSS__[scenario]_[year].csvO3_MORT_[scenario]_[year].csvO3_YLL_[scenario]_[year].csvO3_DALY_[scenario]_[year].csvO3_MORT_ECOLOSS_[scenario]_[year].csvO3_YLL_ECOLOSS__[scenario]_[year].csv
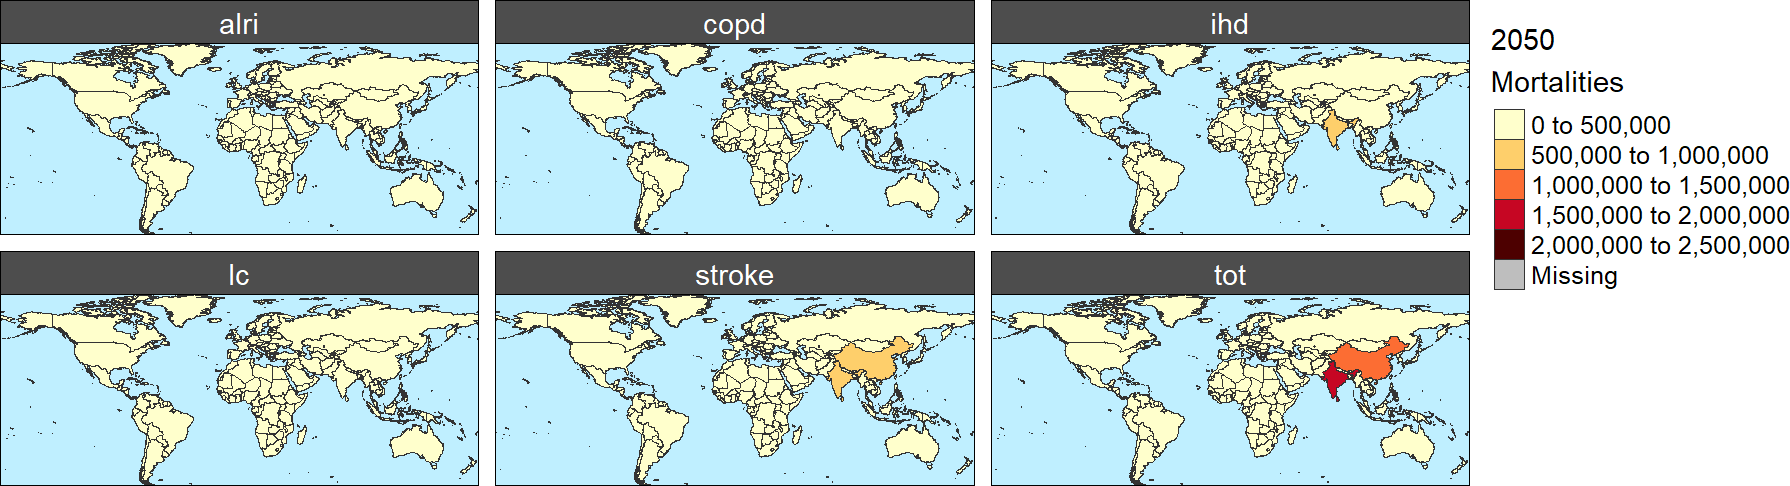
As in Module 2, for all these functions, the package allows to produce different figures and/or animations, generated using the rmap package documented in the following page. To generate these maps, the user needs to include the map=T parameter, and they will be generated and stored in the corresponding output sub-directory. As an example for this module, the following map shows the premature mortalities attributable to PM2.5 exposure by cause in 2050.
*Premature Mortalities attributable to PM2.5 concentration by cause in 2050 (#)*
JGCRI/rfasst documentation built on Feb. 2, 2023, 12:14 a.m.
R Package Documentation
Browse R Packages
We want your feedback!
Note that we can't provide technical support on individual packages. You should contact the package authors for that.
knitr::opts_chunk$set( collapse = TRUE, comment = "#>" )
The functions in this module estimate adverse health effects attributable to fine particulate matter (PM2.5) and ozone (O3; M6M) exposure, measured as premature mortalities, years of life lost (YLLs), and disability adjusted life years (DALYs). The following code shows as an example, the functions to estimate premature mortalities attributable to PM2.5 and the DALYs associated with ozone exposure (M6M).All the functions associated to this module can be found in the References page.
library(rfasst) library(magrittr) db_path<-"path_to_your_gcam_database" query_path<-"path_to_your_gcam_queries_file" db_name<-"name of the database" prj_name<-"name for a Project to add extracted results to" # (any name should work, avoid spaces just in case) scen_name<-"name of the GCAM scenario", queries<-"Name of the query file" # (the package includes a default query file that includes all the queries required in every function in the packae, "queries_rfasst.xml") # To write the csv files into the output folder: m3_get_mort_pm25(db_path,query_path,db_name,prj_name,scen_name,queries,saveOutput=T, map=F) m3_get_daly_o3(db_path,query_path,db_name,prj_name,scen_name,queries,saveOutput=T, map=F) # To save this data by TM5-FASST region in year 2050 as dataframes: pm25.mort.2050<-dplyr::bind_rows(m3_get_mort_pm25(db_path,query_path,db_name,prj_name,scen_name,queries,saveOutput=F, map=F)) %>% dplyr::filter(year==2050) head(pm25.mort.2050) o3.daly.2050<-dplyr::bind_rows(m3_get_daly_o3(db_path,query_path,db_name,prj_name,scen_name,queries,saveOutput=F, map=F)) %>% dplyr::filter(year==2050) head(o3.daly.2050)
The calculation of premature mortalities is consistent with the Global Burden of Disease 2016 (Lim et al). Mortalities are estimated for five causes, namely stroke, ischemic heart disease (IHD), chronic obstructive pulmonary disease (COPD), acute lower respiratory illness diseases (ALRI) and lung cancer (LC). As explained in the TM5-FASST documentation paper (Van Dingenen et al 2018), cause-specific deaths are estimated following the following equation: $$Mort_{t,r,c,j}=mo_{r,c,j} \cdot ((RR_{c,j}-1)/RR_{c,j})\cdot Pop_{t,r}$$ So premature mortality in period $t$, region $r$, for cause $c$, associated with exposure to pollutant $j$ is calculated as the product between the baseline mortality rate, the change in the RR relative risk of death attributable to a change in population-weighted mean pollutant concentration, and the population exposed.
-
Cause-specific baseline mortality rates are taken from the World Health Organization projections WHO 2013.
-
For PM2.5, relative risk are estimated based on the Integrated Exposure-Response functions (ERFs) from Burnett et al 2014. For O3, relative risk is based on the ERFs from Jerret et al 2009.
-
Population exposed is cause-specific. We assume that for all the causes adults are exposed (>30 Years) while for ALRI, children under 5 years. Population fractions are calculated from the from the SSP database.
Years of life lost and DALYs are estimated by transforming premature mortalities into either YLLs or DALYs using constant ratios. YLL-to-Mortalities ratios are based on a reduction in statistical life expectancy (months) per 10µg/m³ increase in anthropogenic PM2.5 (TM5-FASST calculations). DALY-to-Mortalities ratios are estimated using the latest available data on mortailities and DALYs from the Institute for Health Metrics and Evaluation (IHME). We note that these ratios (both for YLLs and for DALYs) are calculated regionally so they differ across regions.
Economic damages associated to the health impacts are calculated multiplying either the premature mortalities or the years of life lost by the corresponding Value of Statistical Life (VSL) or Value of Statistical Life Year (VSLY). Both the VSL and the VSLY are based on the widely accepted OECD values for 2005. According to the literature, this value ranges between US$1.8 and $4.5 million for VSL. The calculations for all regions are based on the “unit value transfer approach” which adjusts the VSL according to their GDP and GDP growth rates, as detialed in Narain and Sall 2016. In this version, we assume the income elasticity of both the VSL and the VSLY are equal to 0.8, with no adjustments across regions. A potential regional adjustment of these income elasticities will be explored in further developments of the package. We note that the central OECD values could be adjusted by the user. Finally, the damages reported by the functions use the median values of VSL and VSLY for simplicity. The reporting of Lower and Upper Bounds can be selected by the user, but requires some code changes. The systematic reporting of LB and UB is planned for the next package development.
The following code shows some examples for the monetized premature deaths associated to exposure to PM2.5 and monetized years of life lost attributable to O3 exposure:
library(rfasst) library(magrittr) db_path<-"path_to_your_gcam_database" query_path<-"path_to_your_gcam_queries_file" db_name<-"name of the database" prj_name<-" Name for a Project to add extracted results to" # (any name should work, avoid spaces just in case) scen_name<-"Name of the GCAM scenario" queries<-"Name of the query file" # (the package includes a default query file that includes all the queries required in every function in the packae, "queries_rfasst.xml") # To write the csv files into the output folder: m3_get_mort_o3_ecoloss(db_path,query_path,db_name,prj_name,scen_name,queries,saveOutput=T, map=F) m3_get_yll_o3_Ecoloss(db_path,query_path,db_name,prj_name,scen_name,queries,saveOutput=T, map=F) # To save this data by TM5-FASST region in year 2050 as dataframes: pm25.mort.ecoloss.2050<-dplyr::bind_rows(m3_get_mort_o3_ecoloss(db_path,query_path,db_name,prj_name,scen_name,queries,saveOutput=F)) %>% dplyr::filter(year==2050) head(pm25.mort.ecoloss.2050) o3.yll.ecoloss.2050<-dplyr::bind_rows(m3_get_yll_o3_Ecoloss(db_path,query_path,db_name,prj_name,scen_name,queries,saveOutput=F)) %>% dplyr::filter(year==2050) head(o3.yll.ecoloss.2050)
The complete list of outputs generated by the suite of functions that form this module is listed below:
PM25_MORT_[scenario]_[year].csvPM25_YLL_[scenario]_[year].csvPM25_DALY_[scenario]_[year].csvPM25_MORT_ECOLOSS_[scenario]_[year].csvPM25_YLL_ECOLOSS__[scenario]_[year].csvO3_MORT_[scenario]_[year].csvO3_YLL_[scenario]_[year].csvO3_DALY_[scenario]_[year].csvO3_MORT_ECOLOSS_[scenario]_[year].csvO3_YLL_ECOLOSS__[scenario]_[year].csv
As in Module 2, for all these functions, the package allows to produce different figures and/or animations, generated using the rmap package documented in the following page. To generate these maps, the user needs to include the map=T parameter, and they will be generated and stored in the corresponding output sub-directory. As an example for this module, the following map shows the premature mortalities attributable to PM2.5 exposure by cause in 2050.
*Premature Mortalities attributable to PM2.5 concentration by cause in 2050 (#)*
R Package Documentation
Browse R Packages
We want your feedback!
Note that we can't provide technical support on individual packages. You should contact the package authors for that.
Embedding an R snippet on your website
Add the following code to your website.
For more information on customizing the embed code, read Embedding Snippets.