README.md
In zaczap/bluepRint: quick layouts for ggplot2 graphs
bluepRint
layout package for ggplot2, built on top of the cowplot package
introduction
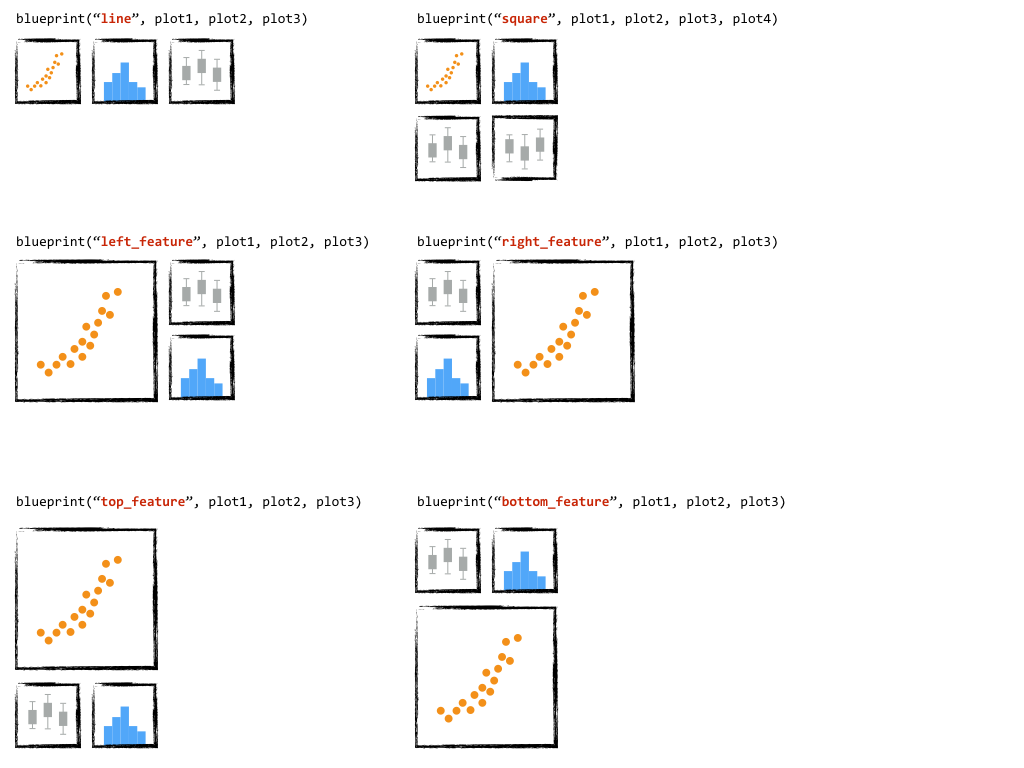
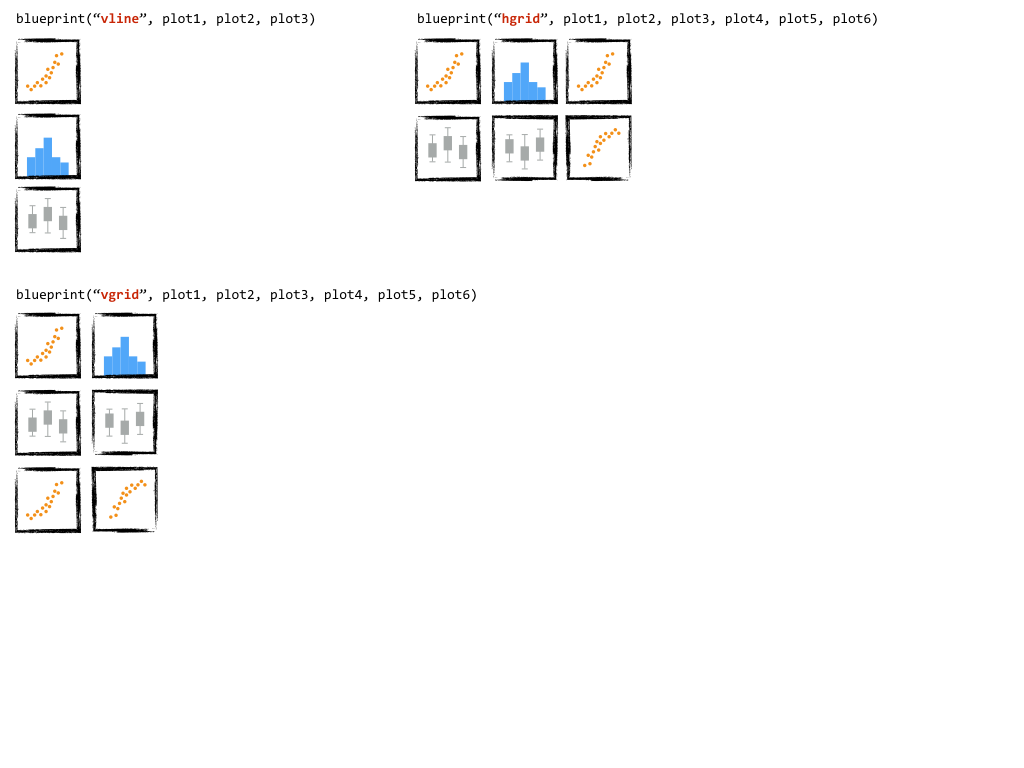
The purpose of this package is to provide an efficient interface for laying out multiple ggplot2 graphs on a single panel using common layout patterns. It's very much a work in progress, but the basics are there.
installation
library("devtools")
devtools::install_github("zaczap/bluepRint")
example
library(ggplot2)
library(bluepRint)

plot1 = ggplot(mtcars, aes(x=wt, y=mpg)) + geom_point() + labs(x='weight',y='miles per gallon (mpg)') + theme_bw()
plot2 = ggplot(mtcars, aes(x=mpg)) + geom_histogram() + labs(x='miles per gallon (mpg)', y='count') + theme_bw()

panel = blueprint('line', plot1, plot2)

or a more complicated layout can easily be achieved:
plot3 = ggplot(mtcars, aes(x=wt)) + geom_histogram() + labs(x='weight', y='count') + theme_bw()

panel = blueprint('left_feature', plot1, plot2, plot3)

reference


zaczap/bluepRint documentation built on May 4, 2019, 9:07 p.m.
bluepRint
layout package for ggplot2, built on top of the cowplot package
introduction
The purpose of this package is to provide an efficient interface for laying out multiple ggplot2 graphs on a single panel using common layout patterns. It's very much a work in progress, but the basics are there.
installation
library("devtools")
devtools::install_github("zaczap/bluepRint")
example
library(ggplot2)
library(bluepRint)
plot1 = ggplot(mtcars, aes(x=wt, y=mpg)) + geom_point() + labs(x='weight',y='miles per gallon (mpg)') + theme_bw()
plot2 = ggplot(mtcars, aes(x=mpg)) + geom_histogram() + labs(x='miles per gallon (mpg)', y='count') + theme_bw()
panel = blueprint('line', plot1, plot2)

or a more complicated layout can easily be achieved:
plot3 = ggplot(mtcars, aes(x=wt)) + geom_histogram() + labs(x='weight', y='count') + theme_bw()
panel = blueprint('left_feature', plot1, plot2, plot3)

reference


Embedding an R snippet on your website
Add the following code to your website.
For more information on customizing the embed code, read Embedding Snippets.
