Nothing
README.md
In igvR: igvR: integrative genomics viewer
igvR
igvR is an R package providing interactive connections to
igv.js
(the Integrative Genomics Viewer) running in a web browser.
I am grateful to Jim Robinson, Helga Thorvaldsdóttir, Douglass Turner and
colleagues for their fine work in igv.js, and their unfailing
responsiveness to all requests and questions.
igvR is based upon the Bioconductor R package
BrowserViz - of which it
is a subclass. It offers easy interactive visual exploration of
genomic data from R:
- Bed (annotation) and BedGraph (quantitative)
tracks can be created out of R data.frames and GenomicRanges
objects.
- Aligment data from bam files via GAlignments objects offered by
the GenomicAlignments class
- variant data from VCF files via VCF objects offered by the
VariantAnnotation class.
This work is motivated by our belief that contemporary web browsers,
supporting HTML5 and Canvas, and running increasingly powerful
Javascript libraries (for example, d3, igv.js and cytoscape.js) have become
the best setting in which to develop interactive graphics for
exploratory data analysis.
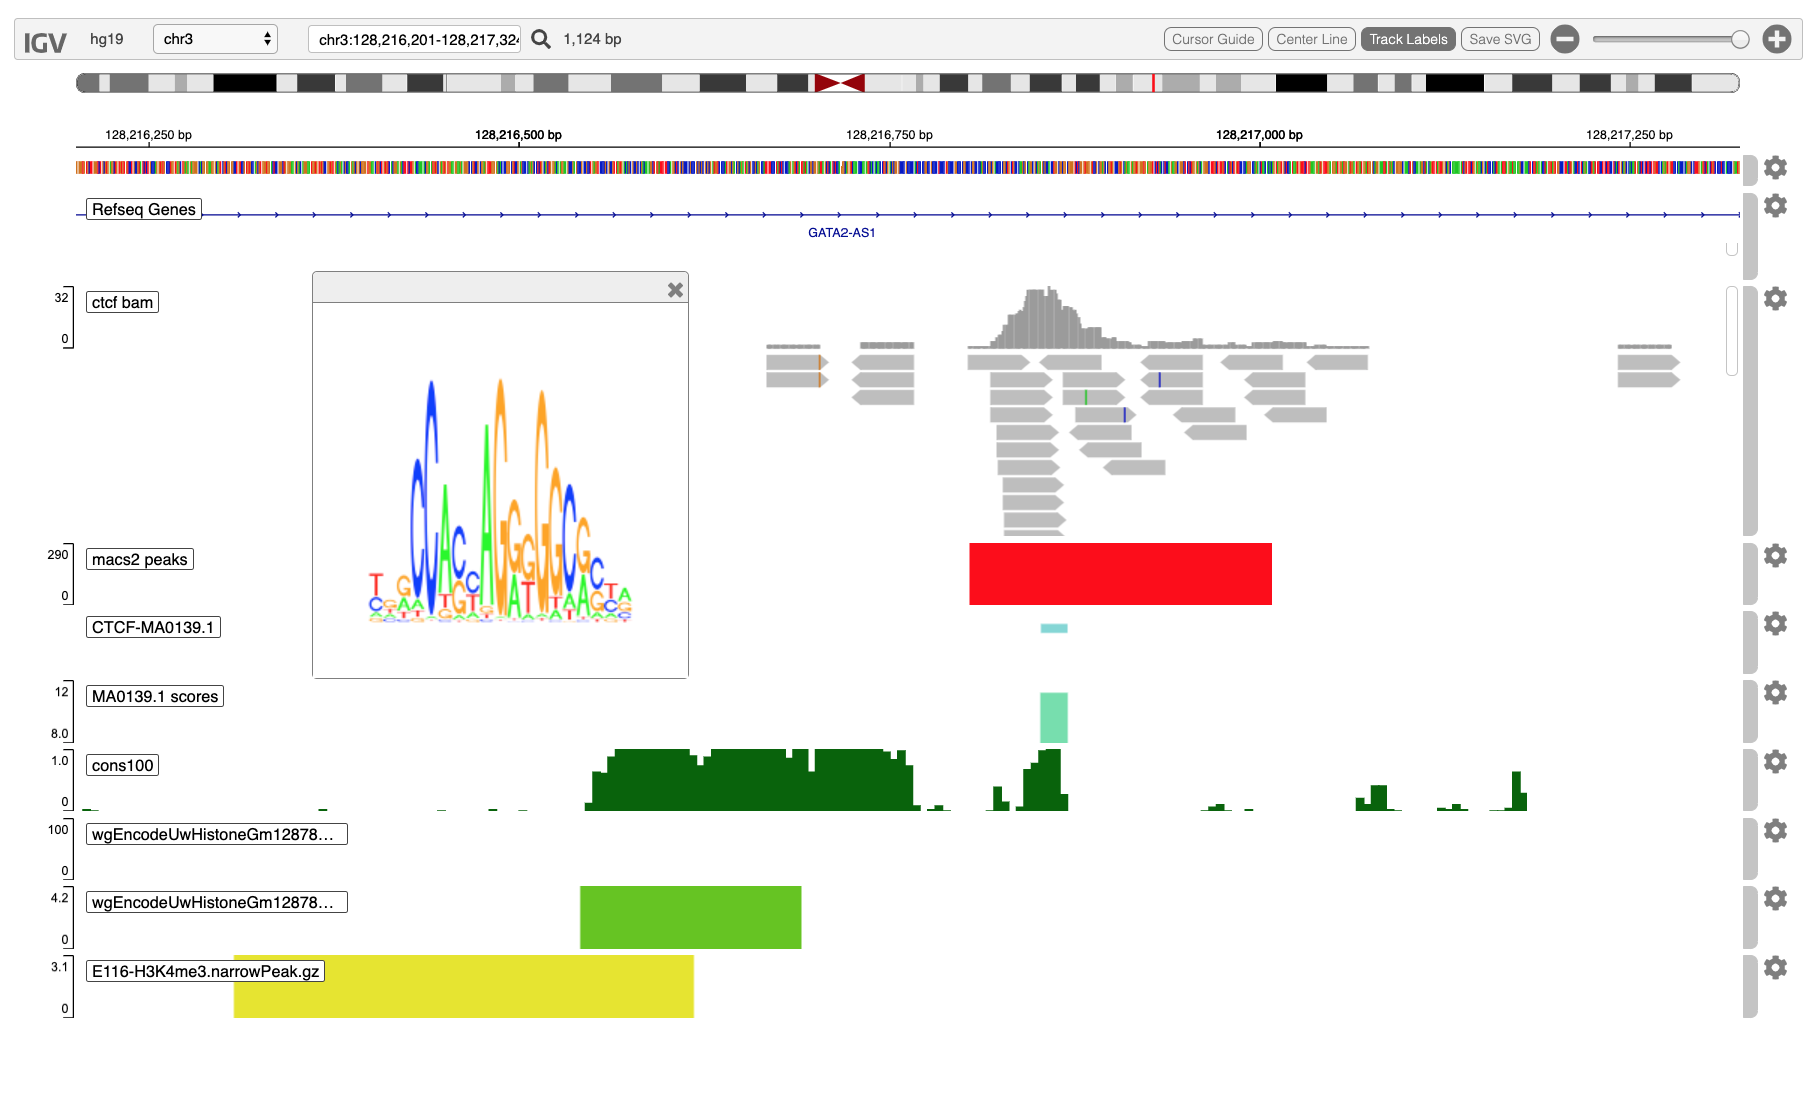
Here, for example, we display a BAM pileup from a ChIP-Seq experiment, accompanied by narrow
peaks called by MACS2, and TF motif matches from MotifDb to sequence
scored by the Bioconductor's Biostrings::matchPWM, and showing a
browser popup with the motif logo associated with the transcription
factor CTCF, obtained by clicking on a region displayed in the lowest
track.
Code for this example is in the vignette titled
"Explore ChIP-seq alignments from a bam file, MACS2 narrowPeaks, conservation, methylation
and motif matching"
Try the igvR package in your browser
Any scripts or data that you put into this service are public.
igvR documentation built on Nov. 8, 2020, 7:14 p.m.
R Package Documentation
Browse R Packages
We want your feedback!
Note that we can't provide technical support on individual packages. You should contact the package authors for that.
igvR
igvR is an R package providing interactive connections to igv.js (the Integrative Genomics Viewer) running in a web browser.
I am grateful to Jim Robinson, Helga Thorvaldsdóttir, Douglass Turner and colleagues for their fine work in igv.js, and their unfailing responsiveness to all requests and questions.
igvR is based upon the Bioconductor R package BrowserViz - of which it is a subclass. It offers easy interactive visual exploration of genomic data from R:
- Bed (annotation) and BedGraph (quantitative) tracks can be created out of R data.frames and GenomicRanges objects.
- Aligment data from bam files via GAlignments objects offered by the GenomicAlignments class
- variant data from VCF files via VCF objects offered by the VariantAnnotation class.
This work is motivated by our belief that contemporary web browsers, supporting HTML5 and Canvas, and running increasingly powerful Javascript libraries (for example, d3, igv.js and cytoscape.js) have become the best setting in which to develop interactive graphics for exploratory data analysis.
Here, for example, we display a BAM pileup from a ChIP-Seq experiment, accompanied by narrow peaks called by MACS2, and TF motif matches from MotifDb to sequence scored by the Bioconductor's Biostrings::matchPWM, and showing a browser popup with the motif logo associated with the transcription factor CTCF, obtained by clicking on a region displayed in the lowest track.
Code for this example is in the vignette titled
"Explore ChIP-seq alignments from a bam file, MACS2 narrowPeaks, conservation, methylation
and motif matching"
Try the igvR package in your browser
Any scripts or data that you put into this service are public.
R Package Documentation
Browse R Packages
We want your feedback!
Note that we can't provide technical support on individual packages. You should contact the package authors for that.
Embedding an R snippet on your website
Add the following code to your website.
For more information on customizing the embed code, read Embedding Snippets.