CholeraDeaths1849: Daily Deaths from Cholera and Diarrhaea in England, 1849
In HistData: Data Sets from the History of Statistics and Data Visualization
CholeraDeaths1849 R Documentation
Daily Deaths from Cholera and Diarrhaea in England, 1849
Description
Deaths from Cholera and Diarrhaea, for each day of the month of each of the
12 months of 1849.
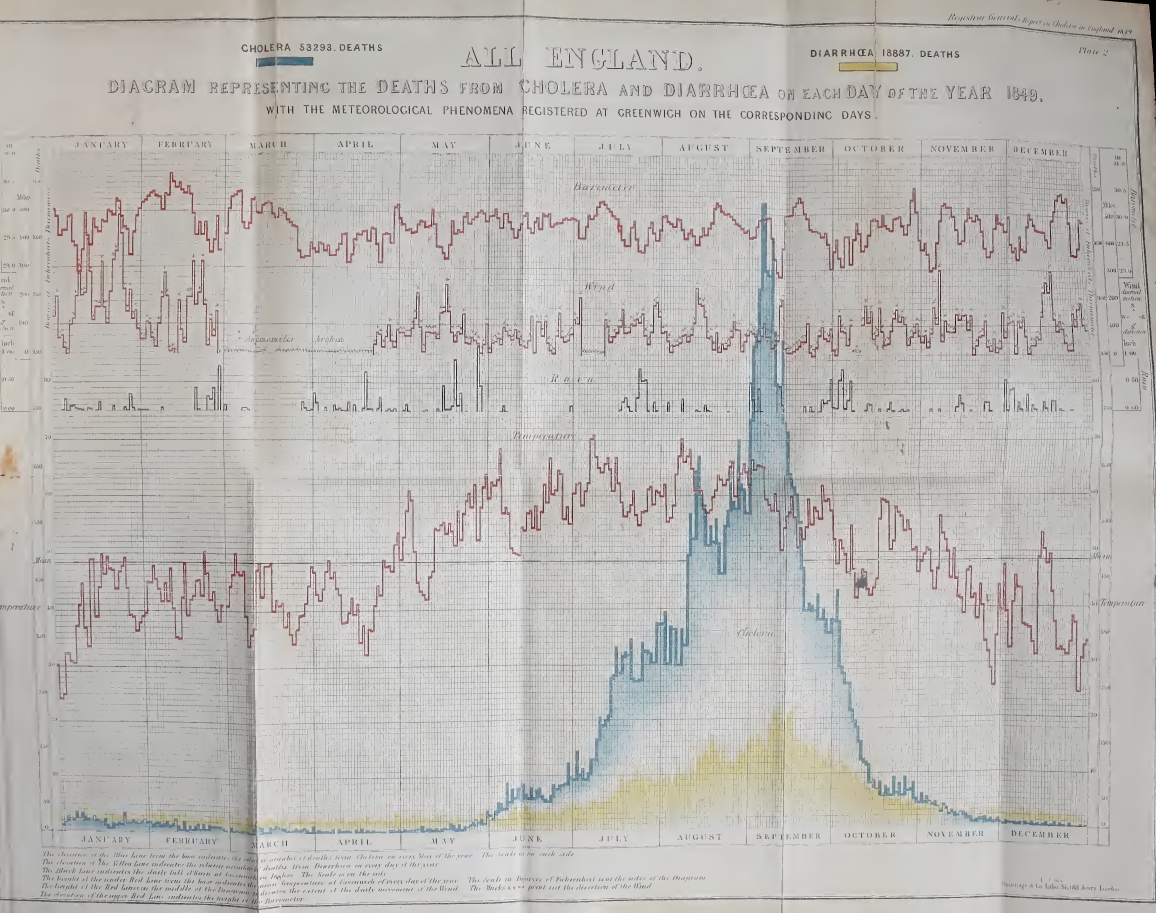
This was used by William Farr (GRO & Farr, 1852, Plate 2) to produce a time
series chart of these deaths, in which he also recorded various
meteorological phenomena (barometer, wind, rain), to see if he could find
any patterns. This chart is available on the web site for Friendly & Wainer
(2021) as Fig 4.1,
https://friendly.github.io/HistDataVis/figs-web/04_1-cholera-diarrhea.png.
James Riley (2023) notes, "Cholera 1849 has special significance — it is
likely to be one of few modern pandemics that was completely unmitigated."
Format
A data frame with 730 observations on the following 6 variables.
montha character vector
cause_of_deatha factor with levels Cholera Diarrhaea
day_of_montha character vector
deathsa numeric vector
datea Date
day_of_weekan ordered factor with levels Mon < Tue < Wed < Thu < Fri < Sat < Sun
Details
The data set was transcribed by James Riley to a spreadsheet,
https://github.com/jimr1603/1849-cholera. He notes, "the scan at
Internet Archive has a fold on day 11. I have derived this column from the
row totals."
Source
The original source is: General Register Office, William Farr
(1852), Report on the Mortality of Cholera in England, 1848-49.
London: Printed by W. Clowes, for HMSO; scanned by the Internet Archive from
the collection of King's College London and available at
https://archive.org/details/b21308251/page/20/mode/2up.
References
Friendly, M. & Wainer, H. (2021). A History of Data
Visualization and Graphic Communication, Harvard University Press.
ISBN 9780674975231.
Riley, J. (2023). "Cholera in Victorian England", blog post,
https://openor.blog/2023/07/27/cholera-in-victorian-england/.
See Also
Cholera, Snow.deaths
Examples
data(CholeraDeaths1849)
str(CholeraDeaths1849)

# Reproduce Farr's (1852) plate 2
library(ggplot2)
CholeraDeaths1849  |>
  ggplot(aes(x = date, y = deaths, colour = cause_of_death)) +
  geom_line(linewidth = 1.2) +
  theme_bw(base_size = 14) +
  theme(legend.position = "top")
HistData documentation built on Dec. 1, 2025, 1:09 a.m.
R Package Documentation
Browse R Packages
We want your feedback!
Note that we can't provide technical support on individual packages. You should contact the package authors for that.
| CholeraDeaths1849 | R Documentation |
Daily Deaths from Cholera and Diarrhaea in England, 1849
Description
Deaths from Cholera and Diarrhaea, for each day of the month of each of the 12 months of 1849.
This was used by William Farr (GRO & Farr, 1852, Plate 2) to produce a time series chart of these deaths, in which he also recorded various meteorological phenomena (barometer, wind, rain), to see if he could find any patterns. This chart is available on the web site for Friendly & Wainer (2021) as Fig 4.1, https://friendly.github.io/HistDataVis/figs-web/04_1-cholera-diarrhea.png.
James Riley (2023) notes, "Cholera 1849 has special significance — it is likely to be one of few modern pandemics that was completely unmitigated."
Format
A data frame with 730 observations on the following 6 variables.
montha character vector
cause_of_deatha factor with levels
CholeraDiarrhaeaday_of_montha character vector
deathsa numeric vector
datea Date
day_of_weekan ordered factor with levels
Mon<Tue<Wed<Thu<Fri<Sat<Sun
Details
The data set was transcribed by James Riley to a spreadsheet, https://github.com/jimr1603/1849-cholera. He notes, "the scan at Internet Archive has a fold on day 11. I have derived this column from the row totals."
Source
The original source is: General Register Office, William Farr (1852), Report on the Mortality of Cholera in England, 1848-49. London: Printed by W. Clowes, for HMSO; scanned by the Internet Archive from the collection of King's College London and available at https://archive.org/details/b21308251/page/20/mode/2up.
References
Friendly, M. & Wainer, H. (2021). A History of Data Visualization and Graphic Communication, Harvard University Press. ISBN 9780674975231.
Riley, J. (2023). "Cholera in Victorian England", blog post, https://openor.blog/2023/07/27/cholera-in-victorian-england/.
See Also
Cholera, Snow.deaths
Examples
data(CholeraDeaths1849)
str(CholeraDeaths1849)
# Reproduce Farr's (1852) plate 2
library(ggplot2)
CholeraDeaths1849 |>
ggplot(aes(x = date, y = deaths, colour = cause_of_death)) +
geom_line(linewidth = 1.2) +
theme_bw(base_size = 14) +
theme(legend.position = "top")
R Package Documentation
Browse R Packages
We want your feedback!
Note that we can't provide technical support on individual packages. You should contact the package authors for that.
Embedding an R snippet on your website
Add the following code to your website.
For more information on customizing the embed code, read Embedding Snippets.