Nothing
README.md
In mnmer: '(m,n)-mer' - A Simple Statistical Feature for Sequence Classification


Conditional frequency distribution
The (m,n)-mer R package was created to summarize biological data into numerical characteristics. It reads a FASTA file and generates a table describing the conditional frequency distribution of the selected (m,n)-mer in the sequences. This output is combined with class information to generate the feature matrix for classification.
(m,n)-mers are an alternative for k-mers (Figure 1). We proposed the replacement of the unconditional k-mer frequency by the conditional frequency, which represents the relative frequency of the n-mer conditioned to f m-mer that precedes it. For more details and performance comparison, please see Andrade et al., 2022 (in press).

Fig 1. Comparing k-mer to mn-mer relative frequency.
According to Figure 2, the k-mers are represented as (0,k) and the mn-mers as (m,n).

Fig 2. Numeric representation.
The output table (Figure 3) includes the fasta file accession numbers as an ID column, the relative frequency of mn-mers up to 4^k columns, and class information.
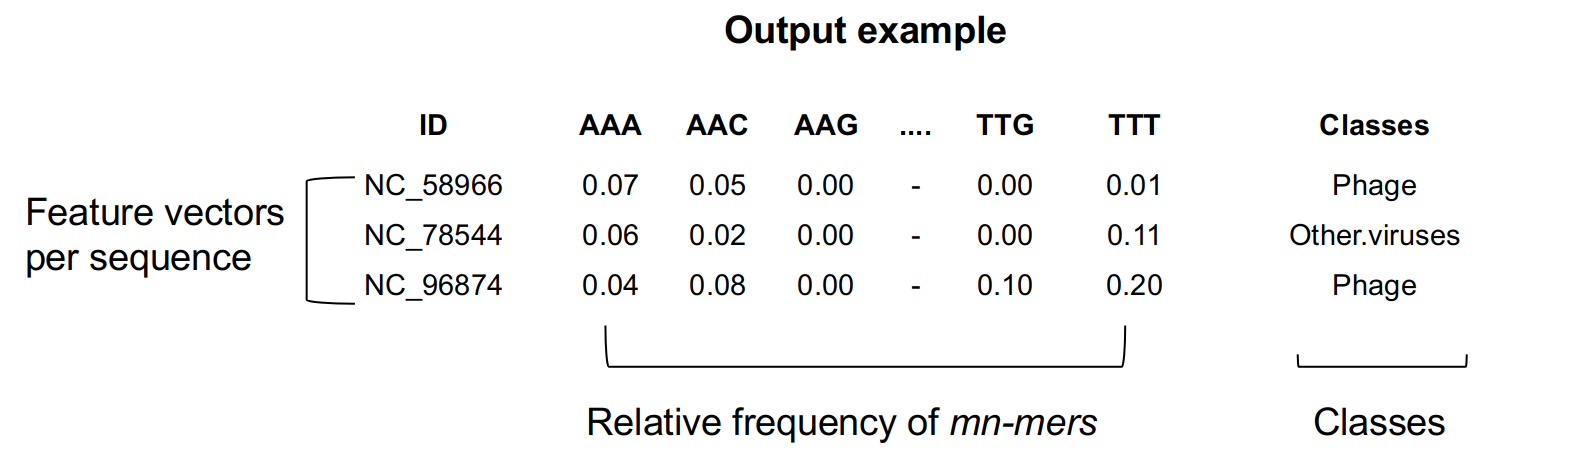 Fig 3. Output example.
Dependencies
The package needs R(>= 4.2.0), Biostrings(>= 3.1) and Utils(>= 2.0.0).
Installation
library(devtools)

install_github("labinfo-lncc/mnmer", ref="main")
Quick Start: Running (m,n)-mer on example dataset
library("mnmer")
dir <-system.file("extdata", package="mnmer")
Assume we need to distinguish between viruses that infect human and viruses that exclusively infect plants.
The readNumFASTA function employs Biostrings for reading FASTA files into the R system. It enables users to limit the number of sequences loaded, select sequences at random, and set a non-ACTG base cutoff percentage.
The parameters are:
FASTAfile = It could be a multiFASTA.
size = Number of sequences to be loaded.
rand = Select sequences randomly or not. Set TRUE or FALSE
pni = Percentage of non-ACTG (default = 0.20)
As default, all sequences more than 20% of N + IUPAC bases will be removed from further analysis given the little informative nature of those bases. If the user would like to accept these sequences, the pni parameter should be set to 0.00. The readNumFASTA function returns an DNAStringSet data structure, used by the mnmer in further analysis. To learn more about DNAStringSet please check Biostrings documentation.
human <-readNumFASTA((file.path(dir, "human_vir.fasta.gz")), 1000,TRUE,0.50)
plant <-readNumFASTA((file.path(dir, "plant_vir.fasta.gz")), 1000,TRUE,0.50)
Producing k-mers
The mnmer function generates the feature matrix using conditional probability from DNAStringSet objects.
This function can generate both k-mers and mn-mers.
The parameter m is set to choice for k-mer generation, while the parameter n is set to zero. Considering that the k-mers are conditioned to zero bases.
human_02mer <- mnmer(human,2,0)
plant_02mer <- mnmer(plant,2,0)
Producing (m,n)-mers
The m and n parameters are chosen by the user for mn-mer creation. For instance, m = 1 and m = 1 yield the (1,1)-mer, in which one base is conditioned on the frequency of one preceding base.
human_21mer <- mnmer(human,2,1)
plant_21mer <- mnmer(plant,2,1)
For classification outside of the mnmer program, we utilize the (1,1)-mer feature matrices. Here's a real-world example of code:
library(data.table)
library(caret)
library(MLeval)

classes <- replicate(nrow(human_21mer), "human.vir")
featureMatrix_human <- cbind(human_21mer,classes)
classes <- replicate(nrow(plant_21mer), "plant.vir")
featureMatrix_plant <- cbind(plant_21mer,classes)

featureMatrix <- rbind(featureMatrix_human, featureMatrix_plant)
featureMatrix <- subset(featureMatrix, select = -c(seqid))
train_index <- createDataPartition(featureMatrix$classes, p=0.8, list=FALSE)
train <- featureMatrix[train_index, ]
test <- featureMatrix[-train_index, ]
control <- trainControl(method="cv", summaryFunction=twoClassSummary, classProbs=T, savePredictions = T)
roc <- train(classes ~ ., data=train, method="rf", preProc=c("center"), trControl=control)
res <- evalm(roc) # Make the ROC plot
This classification produces the metrics shown below:
Metrics | Value
--- | ---
AUC | 1.0000
ROC | 1.0000
Sensibility | 0.9500
Specificity | 1.0000
Work in progress
If you have any queries or find a bug, please submit an issue on GitHub or email atrv@lncc.br.
Try the mnmer package in your browser
Any scripts or data that you put into this service are public.
mnmer documentation built on May 31, 2023, 6:38 p.m.
R Package Documentation
Browse R Packages
We want your feedback!
Note that we can't provide technical support on individual packages. You should contact the package authors for that.
![]()
Conditional frequency distribution
The (m,n)-mer R package was created to summarize biological data into numerical characteristics. It reads a FASTA file and generates a table describing the conditional frequency distribution of the selected (m,n)-mer in the sequences. This output is combined with class information to generate the feature matrix for classification.
(m,n)-mers are an alternative for k-mers (Figure 1). We proposed the replacement of the unconditional k-mer frequency by the conditional frequency, which represents the relative frequency of the n-mer conditioned to f m-mer that precedes it. For more details and performance comparison, please see Andrade et al., 2022 (in press).
Fig 1. Comparing k-mer to mn-mer relative frequency.
According to Figure 2, the k-mers are represented as (0,k) and the mn-mers as (m,n).
Fig 2. Numeric representation.
The output table (Figure 3) includes the fasta file accession numbers as an ID column, the relative frequency of mn-mers up to 4^k columns, and class information.
Fig 3. Output example.
Dependencies
The package needs R(>= 4.2.0), Biostrings(>= 3.1) and Utils(>= 2.0.0).
Installation
library(devtools)
install_github("labinfo-lncc/mnmer", ref="main")
Quick Start: Running (m,n)-mer on example dataset
library("mnmer")
dir <-system.file("extdata", package="mnmer")
Assume we need to distinguish between viruses that infect human and viruses that exclusively infect plants.
The readNumFASTA function employs Biostrings for reading FASTA files into the R system. It enables users to limit the number of sequences loaded, select sequences at random, and set a non-ACTG base cutoff percentage.
The parameters are:
FASTAfile = It could be a multiFASTA.
size = Number of sequences to be loaded.
rand = Select sequences randomly or not. Set TRUE or FALSE
pni = Percentage of non-ACTG (default = 0.20)
As default, all sequences more than 20% of N + IUPAC bases will be removed from further analysis given the little informative nature of those bases. If the user would like to accept these sequences, the pni parameter should be set to 0.00. The readNumFASTA function returns an DNAStringSet data structure, used by the mnmer in further analysis. To learn more about DNAStringSet please check Biostrings documentation.
human <-readNumFASTA((file.path(dir, "human_vir.fasta.gz")), 1000,TRUE,0.50)
plant <-readNumFASTA((file.path(dir, "plant_vir.fasta.gz")), 1000,TRUE,0.50)
Producing k-mers
The mnmer function generates the feature matrix using conditional probability from DNAStringSet objects.
This function can generate both k-mers and mn-mers.
The parameter m is set to choice for k-mer generation, while the parameter n is set to zero. Considering that the k-mers are conditioned to zero bases.
human_02mer <- mnmer(human,2,0)
plant_02mer <- mnmer(plant,2,0)
Producing (m,n)-mers
The m and n parameters are chosen by the user for mn-mer creation. For instance, m = 1 and m = 1 yield the (1,1)-mer, in which one base is conditioned on the frequency of one preceding base.
human_21mer <- mnmer(human,2,1)
plant_21mer <- mnmer(plant,2,1)
For classification outside of the mnmer program, we utilize the (1,1)-mer feature matrices. Here's a real-world example of code:
library(data.table)
library(caret)
library(MLeval)
classes <- replicate(nrow(human_21mer), "human.vir")
featureMatrix_human <- cbind(human_21mer,classes)
classes <- replicate(nrow(plant_21mer), "plant.vir")
featureMatrix_plant <- cbind(plant_21mer,classes)
featureMatrix <- rbind(featureMatrix_human, featureMatrix_plant)
featureMatrix <- subset(featureMatrix, select = -c(seqid))
train_index <- createDataPartition(featureMatrix$classes, p=0.8, list=FALSE)
train <- featureMatrix[train_index, ]
test <- featureMatrix[-train_index, ]
control <- trainControl(method="cv", summaryFunction=twoClassSummary, classProbs=T, savePredictions = T)
roc <- train(classes ~ ., data=train, method="rf", preProc=c("center"), trControl=control)
res <- evalm(roc) # Make the ROC plot
This classification produces the metrics shown below:
Metrics | Value --- | --- AUC | 1.0000 ROC | 1.0000 Sensibility | 0.9500 Specificity | 1.0000
Work in progress
If you have any queries or find a bug, please submit an issue on GitHub or email atrv@lncc.br.
Try the mnmer package in your browser
Any scripts or data that you put into this service are public.
R Package Documentation
Browse R Packages
We want your feedback!
Note that we can't provide technical support on individual packages. You should contact the package authors for that.
Embedding an R snippet on your website
Add the following code to your website.
For more information on customizing the embed code, read Embedding Snippets.