Nothing
Introduction to vosonSML"
In vosonSML: Collecting Social Media Data and Generating Networks for Analysis
The following guide provides an introduction to using vosonSML, which is
available both on GitHub and CRAN. More resources are available on the
VOSON Lab website (vosonSML and training
materials). For a full list of functions, please refer to the reference
page. The companion package to vosonSML is VOSON
Dashboard, which provides an R/Shiny graphical user interface for data
collection (via vosonSML), network and text analysis.
To use vosonSML, you first need to load it into the session:
library(vosonSML)
There are three steps involved in data collection and network creation using vosonSML. These are:
- Authenticate with the platform API, using the function
Authenticate()
- Collect data from the API and store it for later use, using
Collect()
- Create networks from the collected data, using
Create() and Graph()
Twitter
Authenticating with the Twitter API
The first step is to authorise access to the Twitter API. This requires completion of an application and approval for
Twitter Developer access. Once the application has been approved
then the Twitter Developer Portal will become available and a new "Standalone App" can be created. Creation of an app
allows keys to be generated through which software such as vosonSML can access and collect data from the Twitter v1.1
API.
vosonSML is only concerned with reading Twitter data, so a full range of typical third-party app user or bot
functions are not required. The ideal type of authentication for read-only access is application based authentication
with a bearer token that can be generated and found under the Authentication Tokens section of a developers app
project on the Developer Portal. This type of token has higher tweet collection rate-limits than other methods but less
permissions. With a bearer token the Twitter authentication object can be set as follows:
twitterAuth <- Authenticate("twitter", bearerToken = "xxxxxxxxxxxx")
A developer access token can also be created by using all of the developer keys generated for an app. This type of
access is suited to automated software such as bots that are required to undertake a range of read and write Twitter
activities. A developer access token is not required for vosonSML but can be used if desired, it will however have
lower rate-limits than the bearer token:
twitterAuth <- Authenticate(
  "twitter",
  appName = "My App",
  apiKey = "xxxxxxxx",
  apiSecret = "xxxxxxxx",
  accessToken = "xxxxxxxx",
  accessTokenSecret = "xxxxxxxx"
)
There is also a user based access method available in which a Twitter user can permit an app to access the API on
their behalf. This is the method third-party Twitter clients use to allow users to perform Twitter functions such as
posting tweets with their software. When authorizing the software to their account the user will be informed of the
scope of permissions they are granting to the app. This method has the advantage of per-user rather than application
rate-limits. This method is currently only available to be used with vosonSML if the user has access to an app API
key and API secret:
twitterAuth <- Authenticate(
  "twitter",
  appName = "An App",
  apiKey = "xxxxxxxxxxxx",
  apiSecret = "xxxxxxxxxxxx"
)
In all cases, Twitter authentication creates an authentication object with access token that can be re-used in the
future by saving it to disk:
saveRDS(twitterAuth, file = "twitter_auth")
The following loads into the current session a previously-created authentication object:
twitterAuth <- readRDS("twitter_auth")
Collecting Data from Twitter
The syntax for collecting Twitter data follow Twitter's rules and filtering
documentation. It is possible
to collect tweets including particular terms (e.g. hashtags), and boolean searches (see
standard search operators)
are also possible. The collection may be filtered by, for example, type of Twitter activity (e.g. to include retweets
only), number of collected tweets, language of tweet. As an example, the following collects 1000 recent tweets
containing the '#auspol' hashtag (a prominent hashtag for Australian politics), with retweets not being collected.
twitterData <- twitterAuth |>
  Collect(
    searchTerm = "#auspol",
    numTweets = 1000,
    includeRetweets = FALSE,
    writeToFile = TRUE,
    verbose = TRUE
  )
The Collect() function takes the following arguments (when used for collecting Twitter data): credential (object
generated from Authenticate() with class name "twitter"(above we pass this via the pipe), searchTerm (character
string that specifies a Twitter search term), searchType (character string indicating how to filter returned tweets
with options 'recent', 'mixed' or 'popular'; default type is 'recent'), numTweets (numeric vector that specifies how
many tweets to be collected; default is 100), includeRetweets (whether the search should filter out retweets or not;
default is TRUE), retryOnRateLimit (whether to automatically pause collection when the Twitter API rate limit is
reached, and then restart; default is FALSE.), writeToFile (whether to write the returned dataframe to disk as an
.rds file; default is FALSE), and verbose (whether to output information about the data collection; default is
FALSE).
The Collect() function returns a tibble (an enhanced dataframe which has features that can make working with the data
easier). We can view the data we just collected (the following has been modified to anonymise the data):
> twitterData$tweets
# A tibble: 999 x 90
   user_id status_id created_at          screen_name text  source
   <chr>   <chr>     <dttm>              <chr>       <chr> <chr>
 1 xxxxxx… xxxxxxxx… 2020-01-09 12:02:13 xxxx        "htt… Twitt…
 2 xxxxxx… xxxxxxxx… 2020-01-09 12:01:32 xxxxxxxxx   "Fir… Twitt…
 3 xxxxxx… xxxxxxxx… 2020-01-09 12:00:44 xxxxxxxxxxx "Ser… Twitt…
 [snip]
 … with 989 more rows, and 84 more variables: display_text_width <dbl>,
...
Importing Twitter Data
If you are reading a previously saved writeToFile Twitter dataframe from disk, you simply need to use the readRDS
function:
twitterData <- readRDS("2020-09-26_095354-TwitterData.rds")
As vosonSML uses rtweet for data collection you can also import rtweet tweet data from dataframe or .RDS file
using ImportRtweet():
# from dataframe
tweets <- rtweet::search_tweets("#auspol", n = 100)
twitterData <- tweets |> ImportRtweet()

# or from file
twitterData <- ImportRtweet("rtweet_search_n100.rds")
Creating Twitter Networks
It is currently possible to create four types of networks using Twitter data: (1) actor network; (2) activity
network; (3) 2-mode network and (4) semantic network.
Actor Network
In the Twitter actor network, nodes are users who have either tweeted using the target search terms (#auspol in the
above example) or else are mentioned or replied to in tweets featuring the search terms. Edges represent interactions
between Twitter users, and an edge attribute indicates whether the interaction is a mention, reply, retweet, quoted
retweet or self-loop. Self-loop edges are created in two situations: (1) a user authors a tweet and mentions or replies
to themself; (2) a user authors a tweet containing the search term, but does not mention or reply to any other user in
that tweet.
actorNetwork <- twitterData |>
  Create("actor", writeToFile = TRUE, verbose = TRUE)

actorGraph <- actorNetwork |> Graph(writeToFile = TRUE, verbose = TRUE)
Create("actor") returns a named list containing two dataframes named "nodes" and "edges" (the following has been
modified to preserve anonymity):
> actorNetwork
$edges
# A tibble: 1,725 x 5
   from             to              edge_type timestamp         status_id
   <fct>            <fct>           <fct>     <fct>             <fct>
 1 xxxxxxxx         xxxxxxxx        quote     2020-01-09 12:00… xxxxxxxxxxxx…
 2 xxxxxxxx         xxxxxxxxx       quote     2020-01-09 09:37… xxxxxxxxxxxx…
[snip]
# … with 1,715 more rows

$nodes
# A tibble: 1,158 x 2
   user_id             screen_name
   <fct>               <fct>
 1 xxxxxxxx            xxxx
 2 xxxxxxxx            xxxxxxxxx
[snip]
# … with 1,148 more rows

attr(,"class")
[1] "list"    "network" "actor"   "twitter"
This list is then passed to Graph(), which returns an igraph graph object, and in the above example, the
writeToFile parameter is used to write the graph to file in GraphML format. The following shows a summary of the
graph:
> actorGraph
IGRAPH bc177a6 DN-- 1158 1725 --
+ attr: type (g/c), name (v/c), screen_name (v/c), label (v/c),
| edge_type (e/c), timestamp (e/c), status_id (e/c)
+ edges from bc177a6 (vertex names):
 [1] xxxxxxxx           ->xxxxxxxx
 [2] xxxxxxxx           ->xxxxxxxxx
[snip]
+ ... omitted several edges
The Twitter actor network contains a graph attribute type which is set to "twitter" (this attribute is required for
VOSON Dashboard). The following node attributes are collected from the Twitter profile data: name (Twitter ID),
screen_name (Twitter handle or screen name) and label (a concatenation of the ID and screen name). The edge
attributes are: edge_type (whether the edge is a mention, reply, retweet, quoted retweet or self-loop), timestamp
(when the tweet that led to the creation of the edge was authored) and status_id (the Twitter ID for the tweet).
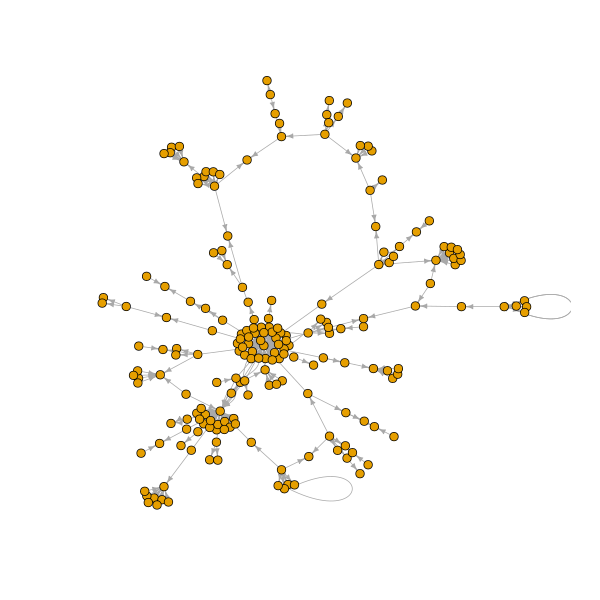
The example actor network contains 1158 nodes and 1725 edges. The following code uses igraph functions to: (1) remove
all edges other than reply edges; (2) construct a subnetwork consisting of the giant component (the largest set of
connected nodes); (3) plot this network.
library(igraph)

# remove edges that are not reply edges
g2 <- delete.edges(actorGraph, which(E(actorGraph)$edge_type != "reply"))

# get the giant component
cc <- clusters(g2)
g2 <- induced_subgraph(g2, which(cc$membership == which.max(cc$csize)))

# open and write plot to a png file
png("twitter_actor_reply_gc.png", width = 600, height = 600)
plot(g2, vertex.label = "", vertex.size = 4, edge.arrow.size = 0.5)
dev.off()
It is often useful to have the tweet text content in the network. This can be achieved by using the status_id edge
attribute to pull the tweet text content from the dataframe returned by Collect(), and store it as an edge attribute.
vosonSML makes this easy with the AddText() function, with the following example creating a graph with an edge
attribute vosonTxt_tweet which stores the tweet text content.
actorGraphWithText <- twitterData |>
  Create("actor") |> AddText(twitterData) |> Graph()
Now we have tweet text content stored as an edge attribute, we can use it for text analysis or creating new node
attributes. As an example, the following creates a new node attribute tweetedBushfires which has the value "yes" if
the Twitter user authored at least one tweet containing the word "bushfire" and "no" otherwise.
# get the index of nodes or users who tweeted the word "bushfire"
ind <- tail_of(
  actorGraphWithText,
  grep("bushfire", tolower(E(actorGraphWithText)$vosonTxt_tweet))
)

# set node attribute
V(actorGraphWithText)$tweetedBushfires <- "no"
V(actorGraphWithText)$tweetedBushfires[ind] <- "yes"
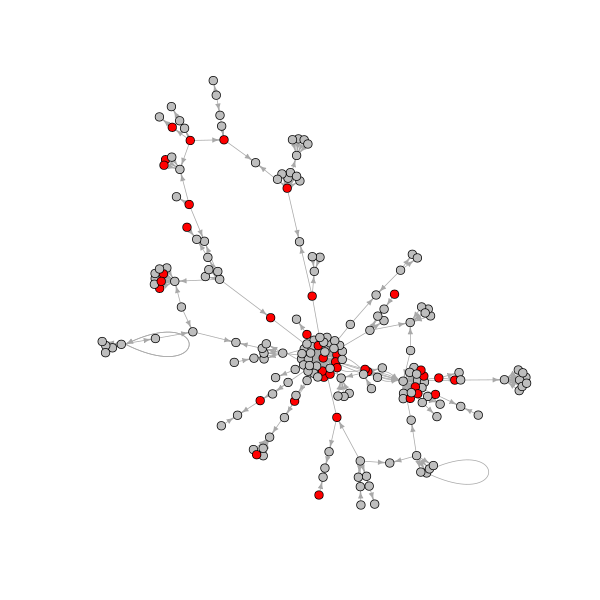
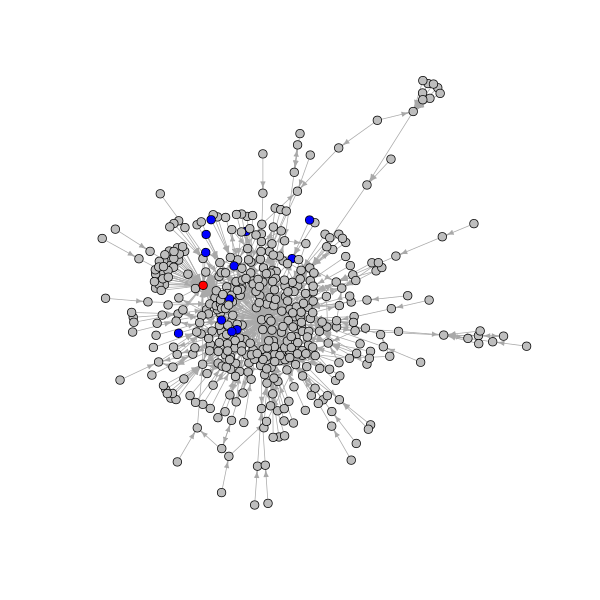
The following creates and plots the giant component in the reply network, with red nodes indicating those users who
tweeted using the term "bushfire".
# remove edges that are not reply edges
g3 <- delete.edges(
  actorGraphWithText, which(E(actorGraphWithText)$edge_type != "reply")
)

# get the giant component
cc <- clusters(g3)
g3 <- induced_subgraph(g3, which(cc$membership == which.max(cc$csize)))

# set node colour based on tweeted bushfires attribute value
V(g3)$color <- ifelse(V(g3)$tweetedBushfires == "yes", "red", "grey")

# open and write plot to a png file
png("twitter_actor_reply_gc_bushfires.png", width = 600, height = 600)
plot(g3, vertex.label = "", vertex.size = 4, edge.arrow.size = 0.5)
dev.off()
The igraph graph object can then be saved to disk as a GraphML file using the igraph function write.graph, and
later imported into network analysis software such as igraph, VOSON Dashboard and Gephi:
# save the graph as a graphml file
write.graph(g3, "twitter_reply_gc_bushfires.graphml", format = "graphml")
Finally, the AddUserData() function can be used to create additional node attributes from the Twitter profile, for
example, number of followers and number of tweets authored by the user.
Note that by default, vosonSML will only collect Twitter profile data for those users who authored tweets that have
been collected. That is, in the above example, profile data will not be collected (by default) for a user who was
mentioned in a tweet that contained #auspol, but did not author such a tweet. The lookupUsers argument can be used to
make additional Twitter API calls and collect the profile data for mentioned users whose profile data is absent, so that
their additional profile attributes can also be added:
# create an actor network with user metadata
actorGraphWithUserAttr <- actorNetwork |>
  AddUserData(twitterData, lookupUsers = TRUE, twitterAuth = twitterAuth) |>
  Graph(writeToFile = TRUE)
Activity Network
In the Twitter activity network, nodes represent tweets and edge types are: replies, retweets and quoted retweets.
# create an activity network with tweet text
activityNetwork <- twitterData |> Create("activity") |> AddText(twitterData)
activityGraph <- activityNetwork |> Graph(writeToFile = TRUE)
Create("activity") returns a named list containing two dataframes named "nodes" and "edges" (the following has been
modified to preserve anonymity):
> activityNetwork
$nodes
# A tibble: 1,408 x 5
   status_id    user_id    screen_name created_at   vosonTxt_tweet
   <chr>        <chr>      <chr>       <chr>        <chr>
 1 xxxxxxxxxxx… xxxxxxxx   xxxx        2020-01-09 … "xxxxxxxxxxxxxxxxxxxxx…
 2 xxxxxxxxxxx… xxxxxxxx   xxxxxxxxx   2020-01-09 … "xxxxxxxxxxxxxxxxxxxxx…
 [snip]
 # … with 1,398 more rows

$edges
# A tibble: 662 x 3
   from                to                  edge_type
   <chr>               <chr>               <chr>
 1 xxxxxxxxxxxxxxxxxxx xxxxxxxxxxxxxxxxxxx quote
 2 xxxxxxxxxxxxxxxxxxx xxxxxxxxxxxxxxxxxxx quote
[snip]
# … with 652 more rows

attr(,"class")
[1] "list"       "network"    "activity"   "twitter"    "voson_text"
Note that in the above, AddText() was used to add the comment text data to the network dataframe, stored as a node
attribute. This list is then passed to Graph(), which returns an igraph graph object (the following has been
anonymised):
> activityGraph
IGRAPH e60c486 DN-- 1408 662 --
+ attr: type (g/c), name (v/c), user_id (v/c), screen_name (v/c),
| created_at (v/c), vosonTxt_tweet (v/c), label (v/c), edge_type (e/c)
+ edges from e60c486 (vertex names):
 [1] xxxx->xxxx
 [2] xxxx->xxxx
[snip]
+ ... omitted several edges
The Twitter activity network contains a graph attribute type (set to "twitter"). The node attributes are: name
(Twitter ID for the tweet), user_id (Twitter ID for the user who authored the tweet), screen_name (Twitter handle or
screen name of the user who authored the tweet), created_at (timestamp when the tweet was authored), vosonTxt_tweet
(text content of the tweet) and label (a concatenation of name and user_id). The edge attribute is edge_type
which can have the value 'reply', 'retweet' or 'quote'.
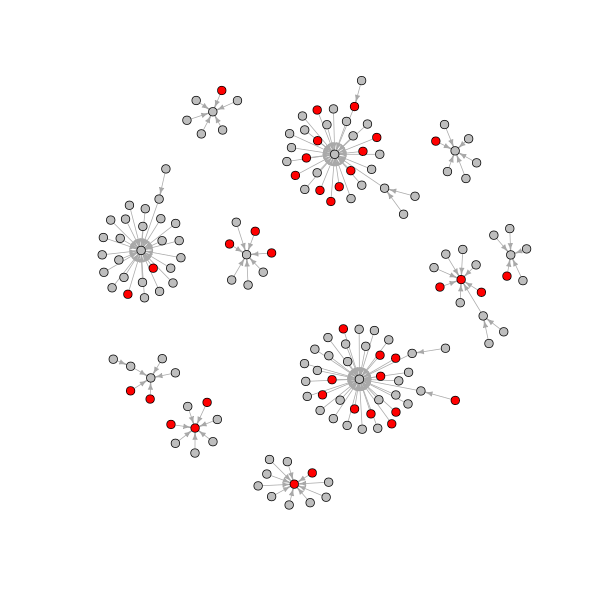
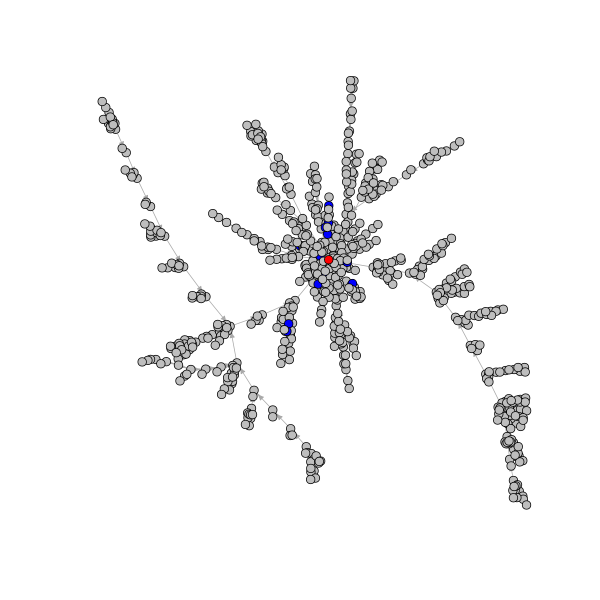
The example Twitter activity network contains 1408 nodes and 662 edges. The following is a visualization of the network,
where nodes are tweets and tweets mentioning bushfires are indicated in red.
# create a subgraph containing nodes of components that have more than 5 nodes
cc <- clusters(activityGraph)
g4 <- induced_subgraph(
  activityGraph,
  which(cc$membership %in% which(cc$csize > 5))
)

# set node colour based on if tweet contains the word "bushfire"
ind <- grep("bushfire", tolower(V(g4)$vosonTxt_tweet))
V(g4)$color <- "grey"
V(g4)$color[ind] <- "red"

# open and write plot to a png file
png("twitter_activity.png", width = 600, height = 600)
plot(g4, vertex.label = "", vertex.size = 4, edge.arrow.size = 0.5)
dev.off()
It should be noted that a limitation of the Twitter API is that retweet chains are not provided. This means that if user
i tweeted an original tweet, and then user j retweeted this tweet, and user k retweeted j's retweet, the
activity network will show edges connecting the two retweets to the original tweet.
2-mode Network
In the Twitter 2-mode network, the two types of nodes are actors (Twitter users) and hashtags. There is an edge from
user i to hashtag j if user i authored a tweet containing hashtag j.
# requires the tidytext package for tokenizing text
install.packages("tidytext")

# create a 2-mode network with the hashtag "#auspol" removed
twomodeNetwork <- twitterData |>
  Create("twomode", removeTermsOrHashtags = c("#auspol"))
twomodeGraph <- twomodeNetwork |> Graph()
Create("twomode") returns a named list containing two dataframes named "nodes" and "edges" (the following has been
modified to preserve anonymity). Note that in this example, the removeTermsOrHashtags argument was used to exclude
'#auspol', since by construction all tweets contained this hashtag.
> twomodeNetwork
$nodes
# A tibble: 1,146 x 2
   entity_id                    display_name
   <chr>                        <chr>
 1 xxxxxxxx                     xxxx
 2 xxxxxxxx                     xxxxxxxxx
 3 #auspol2020                  #auspol2020
 4 #australianbushfiredisaster  #australianbushfiredisaster
[snip]
# … with 1,136 more rows

$edges
# A tibble: 1,675 x 5
   from      to                      edge_type timestamp        status_id
   <fct>     <fct>                   <fct>     <fct>            <fct>
 1 xxxxxxxx  #auspol2020             hashtag   2020-01-09 12:0… xxxxxxxxxxxx…
 2 xxxxxxxx  #australianbushfiredis… hashtag   2020-01-09 12:0… xxxxxxxxxxxx…
[snip]
# … with 1,665 more rows

attr(,"class")
[1] "list"    "network" "twomode" "twitter"
This list is then passed to Graph(), which returns an igraph graph object (this has been anonymised):
> twomodeGraph
IGRAPH 68bd240 DN-- 1146 1675 --
+ attr: type (g/c), name (v/c), display_name (v/c), label (v/c),
| edge_type (e/c), timestamp (e/c), status_id (e/c)
+ edges from 68bd240 (vertex names):
 [1] xxxx -> #auspol2020
 [2] xxxx -> #australianbushfiredisaster
[snip]
+ ... omitted several edges
The Twitter 2-model network has a graph attribute type (set to "twitter"). The node attributes are: name (hashtag or
Twitter user ID), display_name (hashtag or Twitter handle or screen name), label (for users, a concatenation of
name and display_name, while for hashtags it is name). The edge attributes are: edge_type ('hashtag'),
timestamp (timestamp of the tweet that led to the edge), status_id (Twitter ID of the tweet that led to the edge).
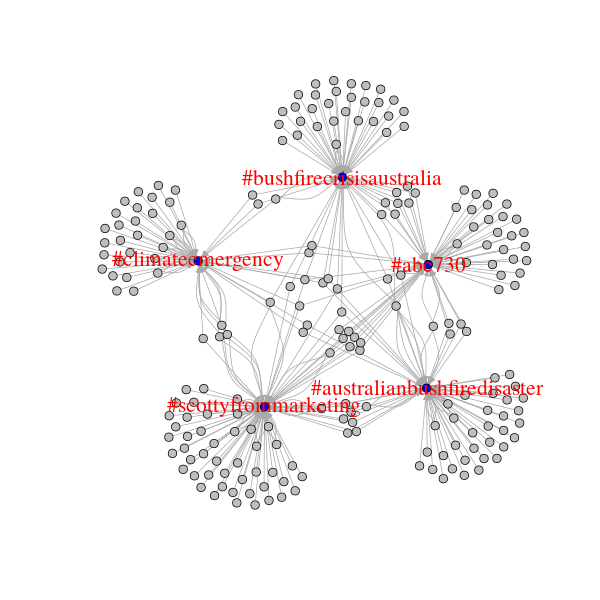
# get index of nodes that are in the top 5 by highest in-degree
# this is the top 5 used hashtags, as all users have 0 in-degree
# in this network
ind <- order(degree(twomodeGraph, mode = "in"), decreasing = TRUE)[1:5]

# get index of nodes with an edge directed to the top 5 hashtags
# this is users who have tweeted with these hashtags
ind2 <- unlist(
  lapply(ind, function(x) neighbors(twomodeGraph, x, mode = "in"))
)

# create a subgraph containing only the top 5 used hashtags and related users
g5 <- induced_subgraph(twomodeGraph, c(ind, as.numeric(ind2)))

# set node colour and label based on in-degree
# only hashtag nodes are set to blue and with label attribute set
V(g5)$color <- "grey"
V(g5)$color[which(degree(g5, mode = "in") > 0)] <- "blue"
V(g5)$label2 <- ifelse(degree(g5, mode = "in") > 0, V(g5)$label, "")

# open and write plot to a png file
png("twitter_twomode.png", width = 600, height = 600)
plot(g5, vertex.label = V(g5)$label2, vertex.size = 4, edge.arrow.size = 0.5,
     vertex.label.cex = 1.8, vertex.label.color = "red")
dev.off()
Semantic Network
In the Twitter semantic network, nodes represent entities extracted from the tweet text: common words, hashtags and
usernames. Edges reflect co-occurrence i.e. there is an edge between entities i and j if they both occurred in the
same tweet.
# additional required packages for tokenization and stopwords
install.packages(c("tidytext", "stopwords"))

# create a semantic network with some common terms removed
# include only the top 5% occurring terms in the network
semanticNetwork <- twitterData |> Create(
   "semantic",
   removeTermsOrHashtags = c("#auspol", "auspol", "australia"),
   termFreq = 5
)

# create an undirected graph
semanticGraph <- semanticNetwork |> Graph(directed = FALSE)
Create("semantic") returns a named list containing two dataframes named "nodes" and "edges":
> semanticNetwork
$nodes
# A tibble: 799 x 1
   value
   <fct>
 1 just
 2 one
 3 fire
 4 going
 5 still
 6 hard
 7 trying
 8 since
 9 try
10 sick
# … with 789 more rows

$edges
# A tibble: 10,990 x 3
   from        to                           weight
   <fct>       <fct>                         <int>
 1 #auspol2020 #australianbushfiredisaster       2
 2 #auspol2020 government                        2
 3 #auspol2020 fire                              4
 4 #auspol2020 australian                        2
 5 #auspol2020 bushfire                          2
 6 #auspol2020 fires                             4
 7 #auspol2020 #australiafires                   1
 8 #auspol2020 #australianbushfiresdisaster      1
 9 #auspol2020 #australia                        4
10 #auspol2020 bushfires                         2
# … with 10,980 more rows

attr(,"class")
[1] "list"     "network"  "semantic" "twitter"
The removeTermsOrHashtags argument is used to exclude terms that we can expect to occur frequently (e.g. because of
the parameters used for the data collection). The termFreq parameter is used to limit the network to the top 5 percent
most frequently occurring entities.
This list is then passed to Graph(), which returns an igraph graph object:
> semanticGraph
IGRAPH cb8c381 UNW- 799 10990 --
+ attr: type (g/c), name (v/c), label (v/c), weight (e/n)
+ edges from cb8c381 (vertex names):
 [1] #australianbushfiredisaster --#auspol2020
 [2] government                  --#auspol2020
 [3] fire                        --#auspol2020
 [4] australian                  --#auspol2020
 [5] bushfire                    --#auspol2020
 [6] fires                       --#auspol2020
 [7] #australiafires             --#auspol2020
 [8] #australianbushfiresdisaster--#auspol2020
+ ... omitted several edges
The Twitter semantic network node contains a graph attribute type (set to "twitter"). The node attributes are: name
(the entity i.e. hashtag or word), label (same as name). The edge attribute is weight (how many tweets the two
entities co-occurred in).
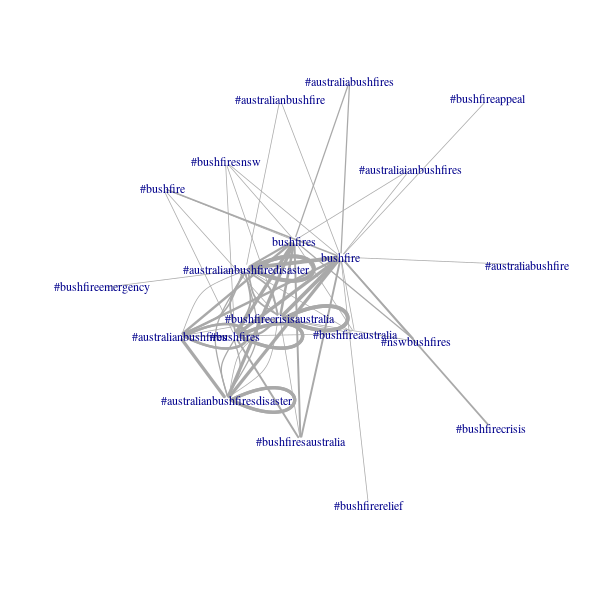
The example Twitter semantic network has 799 nodes and 10990 edges. The following produces a visualisation of
subnetwork of terms that contain the string "bushfire":
# get index of the nodes whose term contains "bushfire"
ind <- grep("bushfire", tolower(V(semanticGraph)$name))

# create a subgraph containing only bushfire terms
g6 <- induced_subgraph(semanticGraph, ind)

# open and write plot to a png file
# plotted with large-graph-layout algorithm and edge weights
png("twitter_semantic.png", width = 600, height = 600)
plot(g6, layout = layout_with_lgl(g6), vertex.shape = "none", vertex.size = 4,
     edge.width = 1 + log(E(g2)$weight))
dev.off()
YouTube
Authenticating with the YouTube API
To collect YouTube data, it is necessary to first create a Google app with access to the YouTube Data API via the
Google APIs console and generate an associated API key. The following
shows the creation of a YouTube access token by passing a Google developer API key to the Autnenticate() function:
# create auth object with api key
youtubeAuth <- Authenticate("youtube", apiKey = "xxxxxxxx")
As with the Twitter example above, the YouTube access token can optionally be saved to disk for use in a later session.
Collecting Data from YouTube
The YouTube video IDs (the part after "=" in the YouTube URL) are required in order to collect YouTube comment data.
These IDs can either be manually provided or automatically extracted from the URLs:
videoIDs <- c(
  "xxxxxx",
  "https://www.youtube.com/watch?v=xxxxxxxx",
  "https://youtu.be/xxxxxxxx")
)
The character vector containing the YouTube video IDs or URLs is passed as a parameter to the Collect() function (the
following code also shows the YouTube access token being piped to Collect()). In the following example, we are
collecting comments from a YouTube video titled "Australia bushfires - a national catastrophe | DW News", which was
uploaded by the German Deutsche Welle news service on 5th January 2020. The comment data were collected on 10th January
2020: the total number of comments at that time was over 1100, but we are using the maxComments parameter to collect a
maximum of 500 top-level comments (and all the reply comments to these top-level comments).
videoID <- "https://www.youtube.com/watch?v=pJ_NyEYRkLQ"
youtubeData <- youtubeAuth |>
  Collect(videoID, maxComments = 500, writeToFile = TRUE)
The Collect() function takes the following arguments (when used for collecting YouTube data): credential (object
generated from Authenticate() with class name "youtube" (above we pass this via the pipe), videoIDs (character
vector specifying one or more youtube video IDs), maxComments (numeric integer specifying how many top-level comments
to collect from each video), writeToFile (whether to write the returned dataframe to disk as an .rds file; default
is FALSE), and verbose (whether to output information about the data collection; default is FALSE).
Collect() returns an R dataframe with the following structure (data have been modified to preserve anonymity):
> str(youtubeData)
Classes ‘dataource’, ‘youtube’ and 'data.frame':    603 obs. of  12 variables:
 $ Comment              : chr  "xxxxx"
 $ AuthorDisplayName    : chr  "xx" "xx" "xx" "xx"
 $ AuthorProfileImageUrl: chr  "https://xx" "https://xx" "https://xx"
 $ AuthorChannelUrl     : chr  "http://xx" "http://xx" "http://xx" "http://xx"
 $ AuthorChannelID      : chr  "xx" "xx" "xx" "xx"
 $ ReplyCount           : chr  "0" "0" "0" "0"
 $ LikeCount            : chr  "0" "0" "0" "0"
 $ PublishedAt          : chr  "2020-01-10T02:23:43" "2020-01-09T20:56:23"
                               "2020-01-09T20:44:00" "2020-01-09T19:31:32"
 $ UpdatedAt            : chr  "2020-01-10T02:23:43" "2020-01-09T20:56:23"
                               "2020-01-09T20:44:00" "2020-01-09T19:31:32"
 $ CommentID            : chr  "xx" "xx" "xx" "xx"
 $ ParentID             : chr  NA NA NA NA
 $ VideoID              : chr  "pJ_NyLQ" "pJ_NyLQ" "pJ_NyLQ" "pJ_NyLQ"
Importing saved collection data from file
If you are reading a previously saved writeToFile YouTube dataframe from disk, you simply need to use the readRDS
function:
# read dataframe from file
youtubeData <- readRDS("2020-09-26_095354-YoutubeData.rds")
Creating YouTube Networks
It is currently possible to create two types of networks using YouTube data: (1) actor network and (2) activity
network.
Actor Network
In the YouTube actor network the nodes are users who have commented on videos (and the videos themselves are included
in the network as special nodes) and the edges are the interactions between users in the comments. We can distinguish a
top-level comment, which is a comment that is directed to a video from a reply comment, which is a comment directed
to a top-level comment. The YouTube user interface does not allow a user to direct a reply to another reply. However,
users can achieve the "reply to a reply" functionality by starting their comment with the username of the person that
they are replying to (and they often prepend the username with "@"). So there will be an edge from user i to user j
if i replied to a top-level comment authored by j or else i prepended their comment with j's username.
actorNetwork <- youtubeData |> Create("actor") |> AddText(youtubeData)
actorGraph <- actorNetwork |> Graph(writeToFile = TRUE)
Create("actor") returns a named list containing two dataframes named "nodes" and "edges" (the following has been
modified to preserve anonymity):
> actorNetwork
$nodes
# A tibble: 522 x 3
   id                       screen_name                         node_type
   <chr>                    <chr>                               <chr>
 1 xxxxxxxxxxxxxxxxxxxxxxxxx xxxxxxxxxxxxxx                      actor
 2 xxxxxxxxxxxxxxxxxxxxxxxxx xxxxxxxxxxxxx                       actor
[snip]
# … with 512 more rows

$edges
# A tibble: 604 x 6
   from      to       video_id comment_id   edge_type vosonTxt_comment
   <chr>     <chr>    <chr>    <chr>        <chr>     <chr>
 1 xxxxxxxx… VIDEOID… pJ_NyEY… xxxxxxxxxxx… comment   "xxxxx"
 2 xxxxxxxx… VIDEOID… pJ_NyEY… xxxxxxxxxxx… comment   "xxxxx"
[snip]
# … with 594 more rows

attr(,"class")
[1] "list"       "network"    "actor"      "youtube"    "voson_text"
Note that in the above, AddText() was used to add the comment text data to the network dataframe, stored as an edge
attribute. Also, note that there is an optional parameter replies_from_text that can be passed to AddText() when
used with YouTube network creation, to extract the "reply to reply" comments.
This list is then passed to Graph(), which returns an igraph graph object. Remember that it is possible to achieve
the above using a single line of code:
actorGraph <- youtubeData |> Create("actor") |> AddText(youtubeData) |> Graph()
The following is an an annonymised summary of the igraph graph object.
> actorGraph
IGRAPH 79e5456 DN-- 522 604 --
+ attr: type (g/c), name (v/c), screen_name (v/c), node_type (v/c),
| label (v/c), video_id (e/c), comment_id (e/c), edge_type (e/c),
| vosonTxt_comment (e/c)
+ edges from 79e5456 (vertex names):
[1] xxxx->VIDEOID:pJ_NyEYRkLQ
[2] xxxx->VIDEOID:pJ_NyEYRkLQ
[snip]
+ ... omitted several edges
The YouTube actor network node contains a graph attribute type (set to "youtube"). The node attributes are: name
(Channel ID, which is YouTube's unique user ID), screen_name (the users displayed name), node_type ('actor' or
'video') and label (a concatenation of the ID and screen name). The edge attributes are: video_id (the ID of the
video for which the data have been collected), comment_id (the ID of the comment), edge_type (whether the edge is a
'comment' i.e. top-level comment, 'reply-comment' i.e. reply to top-level comment or reply to reply or 'self-loop',
which is a special edge connecting the video to itself, as a means of including text posted with the video). In the
above example, because of our earlier use of AddText(), there is also an edge attribute vosonTxt_comment which is
the text associated with the comment, reply or video.
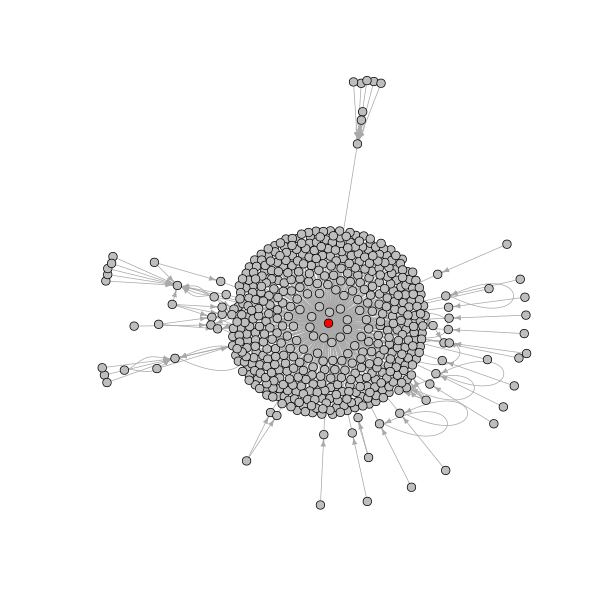
The example YouTube actor network contains 522 nodes and 604 edges. The following indicates that there were 500
top-level comments (we constrained the collection to this number), 103 replies to top-level comments (note: we did not
use AddText() to collect replies embedded within the text), and there is the single self-loop from the video to
itself.
> table(E(actorGraph)$edge_type)
   comment reply-comment     self-loop
       500           103             1
We can visualize this network, using red to identify the video nodes.
# change color of nodes with type video to red and others grey
V(actorGraph)$color <- ifelse(
  V(actorGraph)$node_type == "video", "red", "grey"
)

# open and write plot to a png file
png("youtube_actor.png", width = 600, height = 600)
plot(actorGraph, vertex.label = "", vertex.size = 4, edge.arrow.size = 0.5)
dev.off()
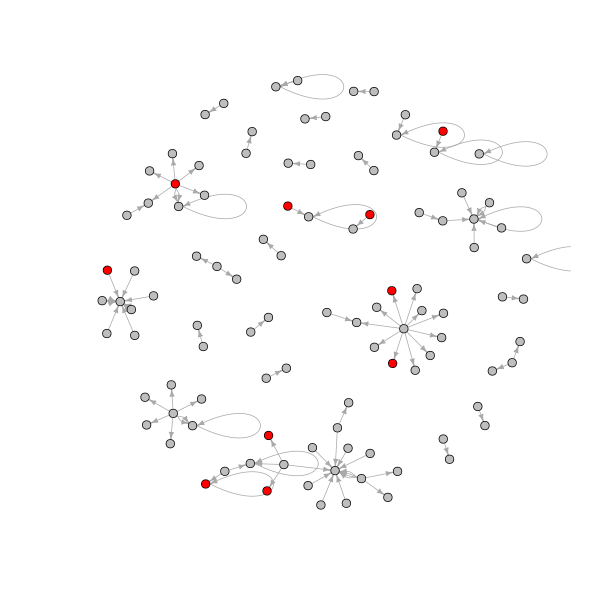
The following creates a sub-network containing only the replies to top-level comments. In removing the other edges
(top-level comments and the self-loop) we create a number isolate nodes (nodes with no connections) that we also remove.
We have also used red to indicate the people who have written comments containing particular terms that have been
present in the online commentary about the bushfires.
# removed edges that are not of type reply-comment
g2 <- delete.edges(
  actorGraph, which(E(actorGraph)$edge_type != "reply-comment")
)

# check number of isolates
> length(which(degree(g2) == 0))
[1] 417

# remove isolates
g2 <- delete.vertices(g2, which(degree(g2) == 0))

# get node indexes for the tails of edges that have comments containing
# words of interest change the indexed node colors to red and others grey
V(g2)$color <- "grey"
ind <- tail_of(
  actorGraph,
  grep("arson|backburn|climate change", tolower(E(g2)$vosonTxt_comment))
)
V(g2)$color[ind] <- "red"

# open and write plot to a png file
png("youtube_actor_reply.png", width = 600, height = 600)
plot(g2, vertex.label = "", vertex.size = 4, edge.arrow.size = 0.5)
dev.off()
Finally, the AddVideoData() function supplements the network data with additional video information.
actorNetwork_withVideoInfo <- actorNetwork |> AddVideoData(youtubeAuth)
AddVideoData() returns a named list containing three dataframes named "nodes" (identical to the dataframe contained in
the list actorNetwork in the example able), "edges" (this has three additional columns: "video_title",
"video_description", "video_published_at") and a new dataframe "videos" (the following has been modified to preserve
anonymity):
> actorNetwork_withVideoInfo
$nodes
# A tibble: 522 x 3
   id                       screen_name                         node_type
   <chr>                    <chr>                               <chr>
 1 xxxxxxxxxxxxxxxxxxxxxxxx xxxxxxxxxxxxx                       actor
 2 xxxxxxxxxxxxxxxxxxxxxxxx xxxxxxxxxxxxx                       actor
[snip]
# … with 512 more rows

$edges
# A tibble: 604 x 9
   from  to    video_id comment_id edge_type vosonTxt_comment video_title
   <chr> <chr> <chr>    <chr>      <chr>     <chr>            <chr>
 1 xxxx… xxxx… pJ_NyEY… xxxxxxxxx… comment   xxxxxxxxxxxx … Australia …
 2 xxxx… xxxx… pJ_NyEY… xxxxxxxxx… comment   "xxxx"         Australia …
[snip]
# … with 594 more rows, and 2 more variables: video_description <chr>,
#   video_published_at <chr>

$videos
# A tibble: 1 x 6
 VideoID  VideoTitle  VideoDescription VideoPublishedAt ChannelID ChannelTitle
 <chr>    <chr>       <chr>            <chr>            <chr>     <chr>
1 pJ_NyEY… Australia … "As Australia ba… 2020-01-05T12:3… UCknLrEd… DW News

attr(,"class")
[1] "list"             "network"          "actor"            "youtube"
[5] "voson_text"       "voson_video_data"
It should also be noted that AddVideoData() can optionally substitute references to the video ID in the "nodes" and
"edges" dataframes with the video publishers channel ID (this is done by setting the parameter actorSubOnly to TRUE.
Activity Network
In the YouTube activity network, nodes are either comments or videos (videos represent a starting comment).
activityNetwork <- youtubeData |> Create("activity") |> AddText(youtubeData)
activityGraph <- activityNetwork |> Graph()
Create("activity") returns a named list containing two dataframes named "nodes" and "edges" (the following has been
modified to preserve anonymity).
> activityNetwork
$edges
# A tibble: 603 x 3
   from                       to                  edge_type
   <chr>                      <chr>               <chr>
 1 xxxxxxxxxxxxxxxxxxxxxxxxxx VIDEOID:pJ_NyEYRkLQ comment
 2 xxxxxxxxxxxxxxxxxxxxxxxxxx VIDEOID:pJ_NyEYRkLQ comment
[snip]
# … with 593 more rows

$nodes
# A tibble: 604 x 8
   id    video_id published_at updated_at author_id screen_name node_type
   <chr> <chr>    <chr>        <chr>      <chr>     <chr>       <chr>
 1 xxxx… pJ_NyEY… 2020-01-10T… 2020-01-1… xxxxxxxx… xxxxxxxxxx… comment
 2 xxxx… pJ_NyEY… 2020-01-09T… 2020-01-0… xxxxxxxx… xxxxxxxxxx… comment
[snip]
# … with 594 more rows, and 1 more variable: vosonTxt_comment <chr>

attr(,"class")
[1] "list"       "network"    "activity"   "youtube"    "voson_text"
Note that in the above, AddText() was used to add the comment text data to the network dataframe, stored as a node
attribute. This list is then passed to Graph(), which returns an igraph graph object (this has been anonymised).
IGRAPH 02664d1 DN-- 604 603 --
+ attr: type (g/c), name (v/c), video_id (v/c), published_at (v/c),
| updated_at (v/c), author_id (v/c), screen_name (v/c), node_type
| (v/c), vosonTxt_comment (v/c), label (v/c), edge_type (e/c)
+ edges from 02664d1 (vertex names):
[1] xxxx->VIDEOID:pJ_NyEYRkLQ
[2] xxxx->VIDEOID:pJ_NyEYRkLQ
[3] xxxx->VIDEOID:pJ_NyEYRkLQ
[4] xxxx->VIDEOID:pJ_NyEYRkLQ
[5] xxxx->VIDEOID:pJ_NyEYRkLQ
[6] xxxx->VIDEOID:pJ_NyEYRkLQ
+ ... omitted several edges
The YouTube activity network contains a graph attribute type (set to "youtube"). The node attributes are: name
(character string ID number for the comment or video), video_id (character string ID of the video for which the
comments collected - in this example, "pJ_NyEYRkLQ"), published_at (timestamp of when the comment was published, this
is NA for the video itself), updated_at (timestamp of when a comment was updated), author_id (user's Channel ID),
screen_name (user's display name), node_type (whether the node is a 'comment' i.e. top-level comment,
'reply-comment' i.e. reply to top-level comment or reply to reply or 'video'), vosonText_comment (the comment text,
NA for the video), label (concatenation of name and screen_name). The edge attributes edge_type which is
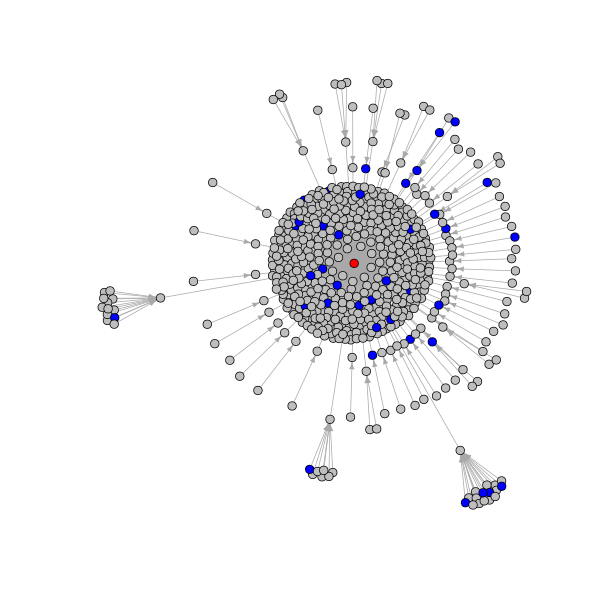
'comment' for all edges connecting a top-level comment to the video, and 'reply-comment' for all other edges.
The example YouTube activity network contains 604 nodes and 603 edges. The following is an igraph visualization of the
network, where the video is indicated by a red node, and blue indicates comments that include one of the following
terms: "arson", "bakcburn", "climate change".
# set all video node colors to red and others to grey
V(activityGraph)$color <- "grey"
V(activityGraph)$color[which(V(activityGraph)$node_type == "video")] <- "red"

# get node indexes of comments that contain terms of interest
# set their node colors to blue
ind <- grep(
  "arson|backburn|climate change", tolower(V(activityGraph)$vosonTxt_comment)
)
V(activityGraph)$color[ind] <- "blue"

# open and write plot to a png file
png("youtube_activity.png", width = 600, height = 600)
plot(activityGraph, vertex.label = "", vertex.size = 4, edge.arrow.size = 0.5)
dev.off()
Reddit
The Reddit collection in vosonSML is based on the approach used in the
RedditExtractoR package.
Authenticating with the Reddit API
The vosonSML does not require Reddit API credentials to be provided. However, to keep the workflow consistent with the
other data sources, we still need to create a "dummy" access token, using the Authenticate() function (see below).
Collecting Data from Reddit
To collect Reddit comment data, first construct a character vector containing the post URL(s).
myThreadUrls <- c(
  "https://www.reddit.com/r/xxxxxx/comments/xxxxxx/x_xxxx_xxxxxxxxx/",
  "https://www.reddit.com/r/xxxxxx/comments/xxxxxx/x_xxxx_xxxxxxxxx/"
)
This character vector is then passed as an argument to the Collect() function. In the example below, a post relating
to the politics around the Australian bushfires was used:
https://www.reddit.com/r/worldnews/comments/elcb9b/australias_leaders_deny_link_between_climate/. This post was created
on 7th January 2020 and by the time of data collection (10th January), it had attracted over 4000 comments. The maximum
number of comments available for retrieval is 500 per thread or post.
Reddit has implemented a feature in their latest site re-design to branch off into new threads, when a thread reaches a
breadth (diameter) of 10 comments. These appear as 'Continue this thread' links in thread discussions on the reddit
site, and as new listing markers within the collected thread data. vosonSML follows these links with additional thread
requests and collects comments from those as well, capturing a more complete data set, as the limit of 500 comments
applies to each 'new' thread.
myThreadUrls <- "https://www.reddit.com/r/worldnews/comments/elcb9b/australias_leaders_deny_link_between_climate/"
redditData <- Authenticate("reddit") |>
              Collect(threadUrls = myThreadUrls, writeToFile = TRUE)
The Collect() function takes the following arguments (when used for collecting Reddit data): credential (an object
generated from Authenticate() with class name "reddit" (above we pass this via the pipe), threadUrls (character
vector of Reddit thread urls), waitTime (a numeric vector giving the time range in seconds to select random wait url
collection requests; default is c(3, 10) i.e. random wait between 3 and 10 seconds), ua (User-Agent string; default
is option("HTTPUserAgent") as set by vosonSML, writeToFile (whether to write the returned dataframe to file as an
.rds file; default is FALSE), verbose (whether to output information about the data collection; default is TRUE).
The Collect() function returns a tibble dataframe (this output has been anonymised):
> str(redditData)
Classes ‘tbl_df’, ‘tbl’, ‘datasource’, ‘reddit’ and 'data.frame':
  767 obs. of  22 variables:
 $ id              : int  1 2 3 4 5 6 7 8 9 10 ...
 $ structure       : chr  "1" "4_1_1_1_1_1_1_1_1_1" "4_1_1_4_2_1_1_1_1_1" ...
 $ post_date       : chr  "2020-01-07 14:34:58" "2020-01-07 14:34:58" ...
 $ post_date_unix  : num  1.58e+09 1.58e+09 1.58e+09 1.58e+09 1.58e+09 ...
 $ comm_id         : chr  "xxxx" "xxxx" "xxxx" "xxxx" ...
 $ comm_date       : chr  "2020-01-07 19:11:10" "2020-01-07 21:04:05" ...
 $ comm_date_unix  : num  1.58e+09 1.58e+09 1.58e+09 1.58e+09 1.58e+09 ...
 $ num_comments    : int  4435 4435 4435 4435 4435 4435 4435 4435 4435 4435 ...
 $ subreddit       : chr  "worldnews" "worldnews" "worldnews" "worldnews" ...
 $ upvote_prop     : num  0.91 0.91 0.91 0.91 0.91 0.91 0.91 0.91 0.91 0.91 ...
 $ post_score      : int  45714 45714 45714 45712 45714 45710 45720 45712 ..
 $ author          : chr  "xxxx" "xxxx" "xxxx" "xxxx" ...
 $ user            : chr  "xxxx" "xxxx" "xxxx" "xxxx" ...
 $ comment_score   : int  1904 136 17 13 9 9 125 4 6 12 ...
 $ controversiality: int  0 0 0 0 0 0 0 0 0 0 ...
 $ comment         : chr  "xxxx...
 $ title           : chr  "Australia’s leaders deny link between climate change and the country’s devastating bushfires" "Australia’s leaders deny link between climate change and the country’s devastating bushfires" "Australia’s leaders deny link between climate change and the country’s devastating bushfires" "Australia’s leaders deny link between climate change and the country’s devastating bushfires" ...
 $ post_text       : chr  "" "" "" "" ...
 $ link            : chr  "https://www.theglobeandmail.com/world/article-australias-leaders-unmoved-on-climate-action-after-devastating-2/" "https://www.theglobeandmail.com/world/article-australias-leaders-unmoved-on-climate-action-after-devastating-2/" "https://www.theglobeandmail.com/world/article-australias-leaders-unmoved-on-climate-action-after-devastating-2/" "https://www.theglobeandmail.com/world/article-australias-leaders-unmoved-on-climate-action-after-devastating-2/" ...
 $ domain          : chr  "theglobeandmail.com" "theglobeandmail.com" "theglobeandmail.com" "theglobeandmail.com" ...
 $ url             : chr  "https://www.reddit.com/r/worldnews/comments/elcb9b/australias_leaders_deny_link_between_climate/" "https://www.reddit.com/r/worldnews/comments/elcb9b/australias_leaders_deny_link_between_climate/" "https://www.reddit.com/r/worldnews/comments/elcb9b/australias_leaders_deny_link_between_climate/" "https://www.reddit.com/r/worldnews/comments/elcb9b/australias_leaders_deny_link_between_climate/" ...
 $ thread_id       : chr  "elcb9b" "elcb9b" "elcb9b" "elcb9b" ...
Importing saved collection data from file
If you are reading a previously saved writeToFile Reddit dataframe from disk, you simply need to use the readRDS
function.
redditData <- readRDS("2020-09-26_095354-RedditData.rds")
Creating Reddit Networks
It is currently possible to create two types of networks using Reddit data: (1) actor network and (2) activity
network.
Actor Network
In the Reddit actor network, nodes represent users who have posted original posts and comments and the edges are the
interactions between users in the comments i.e. where there is an edge from user i to user j if i writes a comment
that replies to user j's comment (or the original post).
The following creates a Reddit actor network with comment text as an edge attribute (as above, this can be achieved in
a single line of code, but we split it into two lines to better explain the objects that are created).
actorNetwork <- redditData |> Create("actor") |> AddText(redditData)
actorGraph <- actorNetwork |> Graph(writeToFile = TRUE)
Create("actor") returns a named list containing two dataframes named "nodes" and "edges" (the following has been
modified to preserve anonymity):
> actorNetwork
$nodes
# A tibble: 439 x 2
      id user
   <int> <chr>
 1     1 xxxxxxxxxx
 2     2 xxxxxxxxxxxxxx
[snip]
# … with 429 more rows

$edges
# A tibble: 768 x 8
    from    to subreddit thread_id comment_id comm_id vosonTxt_comment   title
   <int> <int> <chr>     <chr>        <dbl> <chr>   <chr>                <chr>
 1     1   439 worldnews elcb9b           1 xxxxxxx "xxxxxxxxxxxxxxxxxxx NA
 2     2    73 worldnews elcb9b           2 xxxxxxx "xxxxxxxxxxxxxxxxxxx NA
[snip]
… with 758 more rows

attr(,"class")
[1] "list"       "network"    "actor"      "reddit"     "voson_text"
Note that in the above, AddText() was used to add the comment text data to the network dataframe, stored as an edge
attribute. This list is then passed to Graph(), which returns an igraph graph object.
> actorGraph
IGRAPH 5a5d5b9 DN-- 439 768 --
+ attr: type (g/c), name (v/c), user (v/c), label (v/c), subreddit
| (e/c), thread_id (e/c), comment_id (e/n), comm_id (e/c),
| vosonTxt_comment (e/c), title (e/c)
+ edges from 5a5d5b9 (vertex names):
 [1] 1 ->439 2 ->73  3 ->113 4 ->120 5 ->120 6 ->17  7 ->194 8 ->20  9 ->20
[10] 10->165 11->165 12->1   13->2   14->3   15->4   16->5   17->6   18->7
[19] 19->8   20->9   21->10  22->11  23->12  2 ->13  24->3   7 ->18  25->23
[28] 26->2   3 ->24  27->18  28->1   29->2   18->27  1 ->28  30->2   31->7
[37] 25->1   32->2   33->31  34->1   2 ->32  35->7   25->34  36->2   7 ->35
[46] 37->1   38->2   39->7   40->1   41->2   42->7   43->1   2 ->41  44->7
+ ... omitted several edges
The Reddit actor network contains a graph attribute type (set to "reddit"). The node attributes are: name
(sequential ID number for actor, generated by vosonSML), user (Reddit handle or screen name)) and label (a
concatenation of the ID and screen name). The edge attributes are: subreddit (the subreddit from which the post is
collected), thread_id (the 6 character ID of the thread or post), comment_id (sequential ID number for comment,
generated by vosonSML). There is also an edge attribute title, which is set to NA for all comments except the
comment representing the original post. Further note that the original post is represented as a self-loop edge from the
user who authored the post (and this is how the post text can be accessed, as an edge attribute), however with the
Reddit actor network, there is no edge_type attribute. Finally, because we used AddText() in the above example,
there is also an edge attribute vosonTxt_comment which is the text associated with the comment, or original post.
The example Reddit actor network contains 439 nodes and 768 edges. The following is a visualization of the actor
network, where the author of the post is indicated by a red node, and blue nodes indicate those people who mentioned
"arson" or "starting fires" in at least one of their comments.
# set node color of original post to red based on presence of title edge
# attribute set other node colors to grey
V(actorGraph)$color <- "grey"
V(actorGraph)$color[tail_of(
  actorGraph, which(!is.na(E(actorGraph)$title))
)] <- "red"

# get node indexes for the tails of edges that have comments containing
# words of interest set their node colors to blue
ind <- tail_of(
  actorGraph,
  grep("arson|starting fires",
       tolower(E(actorGraph)$vosonTxt_comment))
)
V(actorGraph)$color[ind] <- "blue"

# open and write plot to a png file
png("reddit_actor.png", width = 600, height = 600)
plot(actorGraph, vertex.label = "", vertex.size = 4, edge.arrow.size = 0.5)
dev.off()
Activity Network
In the Reddit activity network, nodes are either comments and/or initial thread posts and the edges represent replies
to the original post, or replies to comments.
activityNetwork <- redditData |> Create("activity") |> AddText(redditData)
activityGraph <- activityNetwork |> Graph(writeToFile = TRUE)
Create("activity") returns a named list containing two dataframes named "nodes" and "edges" (the following has been
modified to preserve anonymity):
> activityNetwork
$nodes
# A tibble: 768 x 10
   id    thread_id comm_id datetime     ts subreddit user  node_type
   <chr> <chr>     <chr>   <chr>     <dbl> <chr>     <chr> <chr>
 1 elcb… elcb9b    xxxxxxx 2020-01… 1.58e9 worldnews xxxx… comment
 2 elcb… elcb9b    xxxxxxx 2020-01… 1.58e9 worldnews xxxx… comment
[snip]
# … with 758 more rows, and 2 more variables: vosonTxt_comment <chr>,
#   title <chr>

$edges
# A tibble: 767 x 3
   from                       to                       edge_type
   <chr>                      <chr>                    <chr>
 1 elcb9b.1                   elcb9b.0                 comment
 2 elcb9b.4_1_1_1_1_1_1_1_1_1 elcb9b.4_1_1_1_1_1_1_1_1 comment
[snip]
# … with 757 more rows

attr(,"class")
[1] "list"       "network"    "activity"   "reddit"     "voson_text"
Note that in the above, AddText() was used to add the comment text data to the network dataframe, stored as a node
attribute. This list is then passed to Graph(), which returns an igraph graph object.
> activityGraph
IGRAPH 09e30ea DN-- 768 767 --
+ attr: type (g/c), name (v/c), thread_id (v/c), comm_id (v/c),
| datetime (v/c), ts (v/n), subreddit (v/c), user (v/c), node_type
| (v/c), vosonTxt_comment (v/c), title (v/c), label (v/c), edge_type
| (e/c)
+ edges from 09e30ea (vertex names):
[1] elcb9b.1                  ->elcb9b.0
[2] elcb9b.4_1_1_1_1_1_1_1_1_1->elcb9b.4_1_1_1_1_1_1_1_1
[3] elcb9b.4_1_1_4_2_1_1_1_1_1->elcb9b.4_1_1_4_2_1_1_1_1
[4] elcb9b.4_1_1_4_3_1_1_1_3_1->elcb9b.4_1_1_4_3_1_1_1_3
[5] elcb9b.4_1_1_4_3_1_1_1_3_2->elcb9b.4_1_1_4_3_1_1_1_3
+ ... omitted several edges
The Reddit activity network contains a graph attribute type (set to "reddit"). The node attributes are: name (string
showing position of the comment in the thread), date (date when the comment was authored, in DD-MM-YY format),
subreddit (the subreddit from which the post is collected), user (Reddit handle or screen name of the user who
authored the comment or post), node_type ('comment' or 'thread'), title (NA for all nodes except that representing
the original post), label (a concatenation of name and user). Because we used AddText() in the above example,
there is also a node attribute vosonTxt_comment which is the text from the comment, or original post. The edge
attributes is edge_type which is 'comment' for all edges.
The example Reddit activity network contains 768 nodes and 767 edges. The following is a visualisation of the network,
where the post is indicated by a red node, and blue indicates those comments that include the words "arson" or "starting
fires".
# set original post node colors to red based on a node type of thread
# set other node colors to grey
V(activityGraph)$color <- "grey"
V(activityGraph)$color[which(V(activityGraph)$node_type == "thread")] <- "red"

# get node indexes for nodes that have comment attributes containing words of interest
# set their node colors to blue
ind <- grep("arson|starting fires", tolower(V(activityGraph)$vosonTxt_comment))
V(activityGraph)$color[ind] <- "blue"

# open and write plot to a png file
png("reddit_activity.png", width = 600, height = 600)
plot(activityGraph, vertex.label = "", vertex.size = 4, edge.arrow.size = 0.5)
dev.off()
Merging Collected Data
Data that was collected at different times, used different collect parameters or was saved to multiple files can be
merged by using functions that operate on dataframes. The data from Collect is output in tibble (dataframe) format
and provided each collected data set are from the same social media type can be combined using the rbind function.
In the examples below or cases that involve large datasets, it can sometimes be more efficient or timely to substitute
optimized functions such as dplyr::bind_rows for rbind or data.table::rbindlist instead of do.call("rbind",
list).
Merging from multiple Collect operations
Data collected in the same session can be merged using the Merge function. The following twitter example combines
tweet data collected using different search parameters. The result is combined most recent tweets using the #auspol
hashtag and most popular tweets using the #bushfire hashtag.
# collect twitter data for the #auspol hashtag
auspolTwitterData <- twitterAuth |>
  Collect(searchTerm = "#auspol", searchType = "recent", numTweets = 100)

# collect twitter data for the #bushfire hashtag
bushfireTwitterData <- twitterAuth |>
  Collect(searchTerm = "#bushfire", searchType = "popular", numTweets = 50)

# combine the collected data for the different hashtags
twitterData <- Merge(auspolTwitterData, bushfireTwitterData, writeToFile = TRUE)
Merging files in a directory
If there are many data collections to be merged from file vosonSML has a MergeFiles function. In this example a list
of twitter collection files in the 2019TwitterBushfireData directory that end in "TwitterData.rds" are merged
together.
twitterData <- MergeFiles(
  "2019TwitterBushfireData", pattern = "*TwitterData.rds"
)
Creating a network and graph from merged data
Once the data is merged then it can then simply be passed to the Create function to create a network as per the usual
vosonSML work flow.
# create an igraph of twitter actor network
actorGraph <- twitterData |> Create("actor") |> Graph(writeToFile = TRUE)
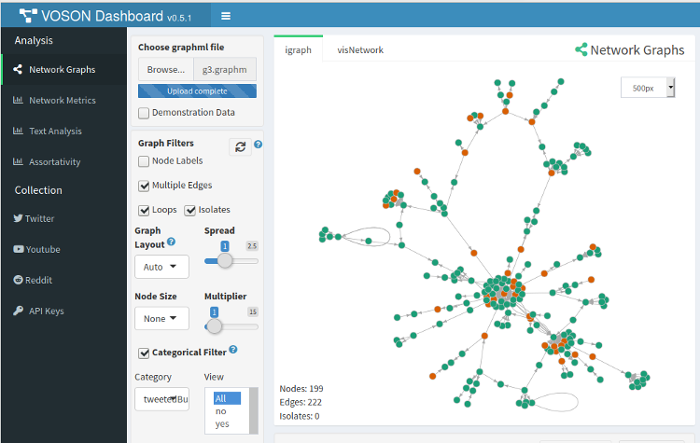
VOSON
Dashboard
It is possible to import a network created using vosonSML, and saved as a ".graphml" file, into VOSON Dashboard.
However, if you have created a categorical node attribute in the network and wish to plot networks in VOSON Dashboard
with node colour reflecting the node attribute, then the node attribute name has to be pre-pended with "vosonCA_". This
let's VOSON Dashboard know the attribute is to be treated as categorical.
Above, we created a Twitter subnetwork: the giant component in the reply network, with red nodes indicating those users
who tweeted using the word "bushfire". We did this by created a node attribute "tweetedBushfires". For VOSON
Dashboard to recognise this node attribute, it has to be named "vosonCA_tweetedBushfires". The following code creates
a new node attribute with this name, and sames the network as a graphml file:
V(g3)$vosonCA_tweetedBushfires <- V(g3)$tweetedBushfires
write.graph(g3, "g3.graphml", format = "graphml")
The following shows a screenshot of VOSON Dashboard with this network loaded and the "tweetedBushfires" attribute has
been seleced to be reflected in the node colour.
Acknowledgements
vosonSML and VOSON Dashboard are developed and maintained at the Virtual Observatory for the Study of Online Networks (VOSON) Lab at the Australian National University.
vosonSML was originally released on CRAN in November 2015 as the package SocialMediaLab (Timothy Graham was the lead
developer), with the significantly revised and renamed vosonSML being released on CRAN in July 2018 (Bryan Gertzel is
the lead developer).
We acknowledge the contributions of Chung-hong Chan who implemented a revised UI (involving magrittr pipes) in the
original SocialMediaLab package and Xiaolan Cai who has contributed to documentation.
Try the vosonSML package in your browser
Any scripts or data that you put into this service are public.
vosonSML documentation built on Aug. 16, 2022, 5:14 p.m.
R Package Documentation
Browse R Packages
We want your feedback!
Note that we can't provide technical support on individual packages. You should contact the package authors for that.
The following guide provides an introduction to using vosonSML, which is
available both on GitHub and CRAN. More resources are available on the
VOSON Lab website (vosonSML and training
materials). For a full list of functions, please refer to the reference
page. The companion package to vosonSML is VOSON
Dashboard, which provides an R/Shiny graphical user interface for data
collection (via vosonSML), network and text analysis.
To use vosonSML, you first need to load it into the session:
library(vosonSML)
There are three steps involved in data collection and network creation using vosonSML. These are:
- Authenticate with the platform API, using the function
Authenticate() - Collect data from the API and store it for later use, using
Collect() - Create networks from the collected data, using
Create()andGraph()
Authenticating with the Twitter API
The first step is to authorise access to the Twitter API. This requires completion of an application and approval for
Twitter Developer access. Once the application has been approved
then the Twitter Developer Portal will become available and a new "Standalone App" can be created. Creation of an app
allows keys to be generated through which software such as vosonSML can access and collect data from the Twitter v1.1
API.
vosonSML is only concerned with reading Twitter data, so a full range of typical third-party app user or bot
functions are not required. The ideal type of authentication for read-only access is application based authentication
with a bearer token that can be generated and found under the Authentication Tokens section of a developers app
project on the Developer Portal. This type of token has higher tweet collection rate-limits than other methods but less
permissions. With a bearer token the Twitter authentication object can be set as follows:
twitterAuth <- Authenticate("twitter", bearerToken = "xxxxxxxxxxxx")
A developer access token can also be created by using all of the developer keys generated for an app. This type of
access is suited to automated software such as bots that are required to undertake a range of read and write Twitter
activities. A developer access token is not required for vosonSML but can be used if desired, it will however have
lower rate-limits than the bearer token:
twitterAuth <- Authenticate( "twitter", appName = "My App", apiKey = "xxxxxxxx", apiSecret = "xxxxxxxx", accessToken = "xxxxxxxx", accessTokenSecret = "xxxxxxxx" )
There is also a user based access method available in which a Twitter user can permit an app to access the API on
their behalf. This is the method third-party Twitter clients use to allow users to perform Twitter functions such as
posting tweets with their software. When authorizing the software to their account the user will be informed of the
scope of permissions they are granting to the app. This method has the advantage of per-user rather than application
rate-limits. This method is currently only available to be used with vosonSML if the user has access to an app API
key and API secret:
twitterAuth <- Authenticate( "twitter", appName = "An App", apiKey = "xxxxxxxxxxxx", apiSecret = "xxxxxxxxxxxx" )
In all cases, Twitter authentication creates an authentication object with access token that can be re-used in the future by saving it to disk:
saveRDS(twitterAuth, file = "twitter_auth")
The following loads into the current session a previously-created authentication object:
twitterAuth <- readRDS("twitter_auth")
Collecting Data from Twitter
The syntax for collecting Twitter data follow Twitter's rules and filtering documentation. It is possible to collect tweets including particular terms (e.g. hashtags), and boolean searches (see standard search operators) are also possible. The collection may be filtered by, for example, type of Twitter activity (e.g. to include retweets only), number of collected tweets, language of tweet. As an example, the following collects 1000 recent tweets containing the '#auspol' hashtag (a prominent hashtag for Australian politics), with retweets not being collected.
twitterData <- twitterAuth |> Collect( searchTerm = "#auspol", numTweets = 1000, includeRetweets = FALSE, writeToFile = TRUE, verbose = TRUE )
The Collect() function takes the following arguments (when used for collecting Twitter data): credential (object
generated from Authenticate() with class name "twitter"(above we pass this via the pipe), searchTerm (character
string that specifies a Twitter search term), searchType (character string indicating how to filter returned tweets
with options 'recent', 'mixed' or 'popular'; default type is 'recent'), numTweets (numeric vector that specifies how
many tweets to be collected; default is 100), includeRetweets (whether the search should filter out retweets or not;
default is TRUE), retryOnRateLimit (whether to automatically pause collection when the Twitter API rate limit is
reached, and then restart; default is FALSE.), writeToFile (whether to write the returned dataframe to disk as an
.rds file; default is FALSE), and verbose (whether to output information about the data collection; default is
FALSE).
The Collect() function returns a tibble (an enhanced dataframe which has features that can make working with the data
easier). We can view the data we just collected (the following has been modified to anonymise the data):
> twitterData$tweets # A tibble: 999 x 90 user_id status_id created_at screen_name text source <chr> <chr> <dttm> <chr> <chr> <chr> 1 xxxxxx… xxxxxxxx… 2020-01-09 12:02:13 xxxx "htt… Twitt… 2 xxxxxx… xxxxxxxx… 2020-01-09 12:01:32 xxxxxxxxx "Fir… Twitt… 3 xxxxxx… xxxxxxxx… 2020-01-09 12:00:44 xxxxxxxxxxx "Ser… Twitt… [snip] … with 989 more rows, and 84 more variables: display_text_width <dbl>, ...
Importing Twitter Data
If you are reading a previously saved writeToFile Twitter dataframe from disk, you simply need to use the readRDS
function:
twitterData <- readRDS("2020-09-26_095354-TwitterData.rds")
As vosonSML uses rtweet for data collection you can also import rtweet tweet data from dataframe or .RDS file
using ImportRtweet():
# from dataframe tweets <- rtweet::search_tweets("#auspol", n = 100) twitterData <- tweets |> ImportRtweet() # or from file twitterData <- ImportRtweet("rtweet_search_n100.rds")
Creating Twitter Networks
It is currently possible to create four types of networks using Twitter data: (1) actor network; (2) activity network; (3) 2-mode network and (4) semantic network.
Actor Network
In the Twitter actor network, nodes are users who have either tweeted using the target search terms (#auspol in the above example) or else are mentioned or replied to in tweets featuring the search terms. Edges represent interactions between Twitter users, and an edge attribute indicates whether the interaction is a mention, reply, retweet, quoted retweet or self-loop. Self-loop edges are created in two situations: (1) a user authors a tweet and mentions or replies to themself; (2) a user authors a tweet containing the search term, but does not mention or reply to any other user in that tweet.
actorNetwork <- twitterData |> Create("actor", writeToFile = TRUE, verbose = TRUE) actorGraph <- actorNetwork |> Graph(writeToFile = TRUE, verbose = TRUE)
Create("actor") returns a named list containing two dataframes named "nodes" and "edges" (the following has been
modified to preserve anonymity):
> actorNetwork $edges # A tibble: 1,725 x 5 from to edge_type timestamp status_id <fct> <fct> <fct> <fct> <fct> 1 xxxxxxxx xxxxxxxx quote 2020-01-09 12:00… xxxxxxxxxxxx… 2 xxxxxxxx xxxxxxxxx quote 2020-01-09 09:37… xxxxxxxxxxxx… [snip] # … with 1,715 more rows $nodes # A tibble: 1,158 x 2 user_id screen_name <fct> <fct> 1 xxxxxxxx xxxx 2 xxxxxxxx xxxxxxxxx [snip] # … with 1,148 more rows attr(,"class") [1] "list" "network" "actor" "twitter"
This list is then passed to Graph(), which returns an igraph graph object, and in the above example, the
writeToFile parameter is used to write the graph to file in GraphML format. The following shows a summary of the
graph:
> actorGraph IGRAPH bc177a6 DN-- 1158 1725 -- + attr: type (g/c), name (v/c), screen_name (v/c), label (v/c), | edge_type (e/c), timestamp (e/c), status_id (e/c) + edges from bc177a6 (vertex names): [1] xxxxxxxx ->xxxxxxxx [2] xxxxxxxx ->xxxxxxxxx [snip] + ... omitted several edges
The Twitter actor network contains a graph attribute type which is set to "twitter" (this attribute is required for
VOSON Dashboard). The following node attributes are collected from the Twitter profile data: name (Twitter ID),
screen_name (Twitter handle or screen name) and label (a concatenation of the ID and screen name). The edge
attributes are: edge_type (whether the edge is a mention, reply, retweet, quoted retweet or self-loop), timestamp
(when the tweet that led to the creation of the edge was authored) and status_id (the Twitter ID for the tweet).
The example actor network contains 1158 nodes and 1725 edges. The following code uses igraph functions to: (1) remove
all edges other than reply edges; (2) construct a subnetwork consisting of the giant component (the largest set of
connected nodes); (3) plot this network.
library(igraph) # remove edges that are not reply edges g2 <- delete.edges(actorGraph, which(E(actorGraph)$edge_type != "reply")) # get the giant component cc <- clusters(g2) g2 <- induced_subgraph(g2, which(cc$membership == which.max(cc$csize))) # open and write plot to a png file png("twitter_actor_reply_gc.png", width = 600, height = 600) plot(g2, vertex.label = "", vertex.size = 4, edge.arrow.size = 0.5) dev.off()
It is often useful to have the tweet text content in the network. This can be achieved by using the status_id edge
attribute to pull the tweet text content from the dataframe returned by Collect(), and store it as an edge attribute.
vosonSML makes this easy with the AddText() function, with the following example creating a graph with an edge
attribute vosonTxt_tweet which stores the tweet text content.
actorGraphWithText <- twitterData |> Create("actor") |> AddText(twitterData) |> Graph()
Now we have tweet text content stored as an edge attribute, we can use it for text analysis or creating new node
attributes. As an example, the following creates a new node attribute tweetedBushfires which has the value "yes" if
the Twitter user authored at least one tweet containing the word "bushfire" and "no" otherwise.
# get the index of nodes or users who tweeted the word "bushfire" ind <- tail_of( actorGraphWithText, grep("bushfire", tolower(E(actorGraphWithText)$vosonTxt_tweet)) ) # set node attribute V(actorGraphWithText)$tweetedBushfires <- "no" V(actorGraphWithText)$tweetedBushfires[ind] <- "yes"
The following creates and plots the giant component in the reply network, with red nodes indicating those users who tweeted using the term "bushfire".
# remove edges that are not reply edges g3 <- delete.edges( actorGraphWithText, which(E(actorGraphWithText)$edge_type != "reply") ) # get the giant component cc <- clusters(g3) g3 <- induced_subgraph(g3, which(cc$membership == which.max(cc$csize))) # set node colour based on tweeted bushfires attribute value V(g3)$color <- ifelse(V(g3)$tweetedBushfires == "yes", "red", "grey") # open and write plot to a png file png("twitter_actor_reply_gc_bushfires.png", width = 600, height = 600) plot(g3, vertex.label = "", vertex.size = 4, edge.arrow.size = 0.5) dev.off()
The igraph graph object can then be saved to disk as a GraphML file using the igraph function write.graph, and
later imported into network analysis software such as igraph, VOSON Dashboard and Gephi:
# save the graph as a graphml file write.graph(g3, "twitter_reply_gc_bushfires.graphml", format = "graphml")
Finally, the AddUserData() function can be used to create additional node attributes from the Twitter profile, for
example, number of followers and number of tweets authored by the user.
Note that by default, vosonSML will only collect Twitter profile data for those users who authored tweets that have
been collected. That is, in the above example, profile data will not be collected (by default) for a user who was
mentioned in a tweet that contained #auspol, but did not author such a tweet. The lookupUsers argument can be used to
make additional Twitter API calls and collect the profile data for mentioned users whose profile data is absent, so that
their additional profile attributes can also be added:
# create an actor network with user metadata actorGraphWithUserAttr <- actorNetwork |> AddUserData(twitterData, lookupUsers = TRUE, twitterAuth = twitterAuth) |> Graph(writeToFile = TRUE)
Activity Network
In the Twitter activity network, nodes represent tweets and edge types are: replies, retweets and quoted retweets.
# create an activity network with tweet text activityNetwork <- twitterData |> Create("activity") |> AddText(twitterData) activityGraph <- activityNetwork |> Graph(writeToFile = TRUE)
Create("activity") returns a named list containing two dataframes named "nodes" and "edges" (the following has been
modified to preserve anonymity):
> activityNetwork $nodes # A tibble: 1,408 x 5 status_id user_id screen_name created_at vosonTxt_tweet <chr> <chr> <chr> <chr> <chr> 1 xxxxxxxxxxx… xxxxxxxx xxxx 2020-01-09 … "xxxxxxxxxxxxxxxxxxxxx… 2 xxxxxxxxxxx… xxxxxxxx xxxxxxxxx 2020-01-09 … "xxxxxxxxxxxxxxxxxxxxx… [snip] # … with 1,398 more rows $edges # A tibble: 662 x 3 from to edge_type <chr> <chr> <chr> 1 xxxxxxxxxxxxxxxxxxx xxxxxxxxxxxxxxxxxxx quote 2 xxxxxxxxxxxxxxxxxxx xxxxxxxxxxxxxxxxxxx quote [snip] # … with 652 more rows attr(,"class") [1] "list" "network" "activity" "twitter" "voson_text"
Note that in the above, AddText() was used to add the comment text data to the network dataframe, stored as a node
attribute. This list is then passed to Graph(), which returns an igraph graph object (the following has been
anonymised):
> activityGraph IGRAPH e60c486 DN-- 1408 662 -- + attr: type (g/c), name (v/c), user_id (v/c), screen_name (v/c), | created_at (v/c), vosonTxt_tweet (v/c), label (v/c), edge_type (e/c) + edges from e60c486 (vertex names): [1] xxxx->xxxx [2] xxxx->xxxx [snip] + ... omitted several edges
The Twitter activity network contains a graph attribute type (set to "twitter"). The node attributes are: name
(Twitter ID for the tweet), user_id (Twitter ID for the user who authored the tweet), screen_name (Twitter handle or
screen name of the user who authored the tweet), created_at (timestamp when the tweet was authored), vosonTxt_tweet
(text content of the tweet) and label (a concatenation of name and user_id). The edge attribute is edge_type
which can have the value 'reply', 'retweet' or 'quote'.
The example Twitter activity network contains 1408 nodes and 662 edges. The following is a visualization of the network, where nodes are tweets and tweets mentioning bushfires are indicated in red.
# create a subgraph containing nodes of components that have more than 5 nodes cc <- clusters(activityGraph) g4 <- induced_subgraph( activityGraph, which(cc$membership %in% which(cc$csize > 5)) ) # set node colour based on if tweet contains the word "bushfire" ind <- grep("bushfire", tolower(V(g4)$vosonTxt_tweet)) V(g4)$color <- "grey" V(g4)$color[ind] <- "red" # open and write plot to a png file png("twitter_activity.png", width = 600, height = 600) plot(g4, vertex.label = "", vertex.size = 4, edge.arrow.size = 0.5) dev.off()
It should be noted that a limitation of the Twitter API is that retweet chains are not provided. This means that if user i tweeted an original tweet, and then user j retweeted this tweet, and user k retweeted j's retweet, the activity network will show edges connecting the two retweets to the original tweet.
2-mode Network
In the Twitter 2-mode network, the two types of nodes are actors (Twitter users) and hashtags. There is an edge from user i to hashtag j if user i authored a tweet containing hashtag j.
# requires the tidytext package for tokenizing text install.packages("tidytext") # create a 2-mode network with the hashtag "#auspol" removed twomodeNetwork <- twitterData |> Create("twomode", removeTermsOrHashtags = c("#auspol")) twomodeGraph <- twomodeNetwork |> Graph()
Create("twomode") returns a named list containing two dataframes named "nodes" and "edges" (the following has been
modified to preserve anonymity). Note that in this example, the removeTermsOrHashtags argument was used to exclude
'#auspol', since by construction all tweets contained this hashtag.
> twomodeNetwork $nodes # A tibble: 1,146 x 2 entity_id display_name <chr> <chr> 1 xxxxxxxx xxxx 2 xxxxxxxx xxxxxxxxx 3 #auspol2020 #auspol2020 4 #australianbushfiredisaster #australianbushfiredisaster [snip] # … with 1,136 more rows $edges # A tibble: 1,675 x 5 from to edge_type timestamp status_id <fct> <fct> <fct> <fct> <fct> 1 xxxxxxxx #auspol2020 hashtag 2020-01-09 12:0… xxxxxxxxxxxx… 2 xxxxxxxx #australianbushfiredis… hashtag 2020-01-09 12:0… xxxxxxxxxxxx… [snip] # … with 1,665 more rows attr(,"class") [1] "list" "network" "twomode" "twitter"
This list is then passed to Graph(), which returns an igraph graph object (this has been anonymised):
> twomodeGraph IGRAPH 68bd240 DN-- 1146 1675 -- + attr: type (g/c), name (v/c), display_name (v/c), label (v/c), | edge_type (e/c), timestamp (e/c), status_id (e/c) + edges from 68bd240 (vertex names): [1] xxxx -> #auspol2020 [2] xxxx -> #australianbushfiredisaster [snip] + ... omitted several edges
The Twitter 2-model network has a graph attribute type (set to "twitter"). The node attributes are: name (hashtag or
Twitter user ID), display_name (hashtag or Twitter handle or screen name), label (for users, a concatenation of
name and display_name, while for hashtags it is name). The edge attributes are: edge_type ('hashtag'),
timestamp (timestamp of the tweet that led to the edge), status_id (Twitter ID of the tweet that led to the edge).
# get index of nodes that are in the top 5 by highest in-degree # this is the top 5 used hashtags, as all users have 0 in-degree # in this network ind <- order(degree(twomodeGraph, mode = "in"), decreasing = TRUE)[1:5] # get index of nodes with an edge directed to the top 5 hashtags # this is users who have tweeted with these hashtags ind2 <- unlist( lapply(ind, function(x) neighbors(twomodeGraph, x, mode = "in")) ) # create a subgraph containing only the top 5 used hashtags and related users g5 <- induced_subgraph(twomodeGraph, c(ind, as.numeric(ind2))) # set node colour and label based on in-degree # only hashtag nodes are set to blue and with label attribute set V(g5)$color <- "grey" V(g5)$color[which(degree(g5, mode = "in") > 0)] <- "blue" V(g5)$label2 <- ifelse(degree(g5, mode = "in") > 0, V(g5)$label, "") # open and write plot to a png file png("twitter_twomode.png", width = 600, height = 600) plot(g5, vertex.label = V(g5)$label2, vertex.size = 4, edge.arrow.size = 0.5, vertex.label.cex = 1.8, vertex.label.color = "red") dev.off()
Semantic Network
In the Twitter semantic network, nodes represent entities extracted from the tweet text: common words, hashtags and usernames. Edges reflect co-occurrence i.e. there is an edge between entities i and j if they both occurred in the same tweet.
# additional required packages for tokenization and stopwords install.packages(c("tidytext", "stopwords")) # create a semantic network with some common terms removed # include only the top 5% occurring terms in the network semanticNetwork <- twitterData |> Create( "semantic", removeTermsOrHashtags = c("#auspol", "auspol", "australia"), termFreq = 5 ) # create an undirected graph semanticGraph <- semanticNetwork |> Graph(directed = FALSE)
Create("semantic") returns a named list containing two dataframes named "nodes" and "edges":
> semanticNetwork $nodes # A tibble: 799 x 1 value <fct> 1 just 2 one 3 fire 4 going 5 still 6 hard 7 trying 8 since 9 try 10 sick # … with 789 more rows $edges # A tibble: 10,990 x 3 from to weight <fct> <fct> <int> 1 #auspol2020 #australianbushfiredisaster 2 2 #auspol2020 government 2 3 #auspol2020 fire 4 4 #auspol2020 australian 2 5 #auspol2020 bushfire 2 6 #auspol2020 fires 4 7 #auspol2020 #australiafires 1 8 #auspol2020 #australianbushfiresdisaster 1 9 #auspol2020 #australia 4 10 #auspol2020 bushfires 2 # … with 10,980 more rows attr(,"class") [1] "list" "network" "semantic" "twitter"
The removeTermsOrHashtags argument is used to exclude terms that we can expect to occur frequently (e.g. because of
the parameters used for the data collection). The termFreq parameter is used to limit the network to the top 5 percent
most frequently occurring entities.
This list is then passed to Graph(), which returns an igraph graph object:
> semanticGraph IGRAPH cb8c381 UNW- 799 10990 -- + attr: type (g/c), name (v/c), label (v/c), weight (e/n) + edges from cb8c381 (vertex names): [1] #australianbushfiredisaster --#auspol2020 [2] government --#auspol2020 [3] fire --#auspol2020 [4] australian --#auspol2020 [5] bushfire --#auspol2020 [6] fires --#auspol2020 [7] #australiafires --#auspol2020 [8] #australianbushfiresdisaster--#auspol2020 + ... omitted several edges
The Twitter semantic network node contains a graph attribute type (set to "twitter"). The node attributes are: name
(the entity i.e. hashtag or word), label (same as name). The edge attribute is weight (how many tweets the two
entities co-occurred in).
The example Twitter semantic network has 799 nodes and 10990 edges. The following produces a visualisation of subnetwork of terms that contain the string "bushfire":
# get index of the nodes whose term contains "bushfire" ind <- grep("bushfire", tolower(V(semanticGraph)$name)) # create a subgraph containing only bushfire terms g6 <- induced_subgraph(semanticGraph, ind) # open and write plot to a png file # plotted with large-graph-layout algorithm and edge weights png("twitter_semantic.png", width = 600, height = 600) plot(g6, layout = layout_with_lgl(g6), vertex.shape = "none", vertex.size = 4, edge.width = 1 + log(E(g2)$weight)) dev.off()
YouTube
Authenticating with the YouTube API
To collect YouTube data, it is necessary to first create a Google app with access to the YouTube Data API via the
Google APIs console and generate an associated API key. The following
shows the creation of a YouTube access token by passing a Google developer API key to the Autnenticate() function:
# create auth object with api key youtubeAuth <- Authenticate("youtube", apiKey = "xxxxxxxx")
As with the Twitter example above, the YouTube access token can optionally be saved to disk for use in a later session.
Collecting Data from YouTube
The YouTube video IDs (the part after "=" in the YouTube URL) are required in order to collect YouTube comment data. These IDs can either be manually provided or automatically extracted from the URLs:
videoIDs <- c( "xxxxxx", "https://www.youtube.com/watch?v=xxxxxxxx", "https://youtu.be/xxxxxxxx") )
The character vector containing the YouTube video IDs or URLs is passed as a parameter to the Collect() function (the
following code also shows the YouTube access token being piped to Collect()). In the following example, we are
collecting comments from a YouTube video titled "Australia bushfires - a national catastrophe | DW News", which was
uploaded by the German Deutsche Welle news service on 5th January 2020. The comment data were collected on 10th January
2020: the total number of comments at that time was over 1100, but we are using the maxComments parameter to collect a
maximum of 500 top-level comments (and all the reply comments to these top-level comments).
videoID <- "https://www.youtube.com/watch?v=pJ_NyEYRkLQ" youtubeData <- youtubeAuth |> Collect(videoID, maxComments = 500, writeToFile = TRUE)
The Collect() function takes the following arguments (when used for collecting YouTube data): credential (object
generated from Authenticate() with class name "youtube" (above we pass this via the pipe), videoIDs (character
vector specifying one or more youtube video IDs), maxComments (numeric integer specifying how many top-level comments
to collect from each video), writeToFile (whether to write the returned dataframe to disk as an .rds file; default
is FALSE), and verbose (whether to output information about the data collection; default is FALSE).
Collect() returns an R dataframe with the following structure (data have been modified to preserve anonymity):
> str(youtubeData) Classes ‘dataource’, ‘youtube’ and 'data.frame': 603 obs. of 12 variables: $ Comment : chr "xxxxx" $ AuthorDisplayName : chr "xx" "xx" "xx" "xx" $ AuthorProfileImageUrl: chr "https://xx" "https://xx" "https://xx" $ AuthorChannelUrl : chr "http://xx" "http://xx" "http://xx" "http://xx" $ AuthorChannelID : chr "xx" "xx" "xx" "xx" $ ReplyCount : chr "0" "0" "0" "0" $ LikeCount : chr "0" "0" "0" "0" $ PublishedAt : chr "2020-01-10T02:23:43" "2020-01-09T20:56:23" "2020-01-09T20:44:00" "2020-01-09T19:31:32" $ UpdatedAt : chr "2020-01-10T02:23:43" "2020-01-09T20:56:23" "2020-01-09T20:44:00" "2020-01-09T19:31:32" $ CommentID : chr "xx" "xx" "xx" "xx" $ ParentID : chr NA NA NA NA $ VideoID : chr "pJ_NyLQ" "pJ_NyLQ" "pJ_NyLQ" "pJ_NyLQ"
Importing saved collection data from file
If you are reading a previously saved writeToFile YouTube dataframe from disk, you simply need to use the readRDS
function:
# read dataframe from file youtubeData <- readRDS("2020-09-26_095354-YoutubeData.rds")
Creating YouTube Networks
It is currently possible to create two types of networks using YouTube data: (1) actor network and (2) activity network.
Actor Network
In the YouTube actor network the nodes are users who have commented on videos (and the videos themselves are included in the network as special nodes) and the edges are the interactions between users in the comments. We can distinguish a top-level comment, which is a comment that is directed to a video from a reply comment, which is a comment directed to a top-level comment. The YouTube user interface does not allow a user to direct a reply to another reply. However, users can achieve the "reply to a reply" functionality by starting their comment with the username of the person that they are replying to (and they often prepend the username with "@"). So there will be an edge from user i to user j if i replied to a top-level comment authored by j or else i prepended their comment with j's username.
actorNetwork <- youtubeData |> Create("actor") |> AddText(youtubeData) actorGraph <- actorNetwork |> Graph(writeToFile = TRUE)
Create("actor") returns a named list containing two dataframes named "nodes" and "edges" (the following has been
modified to preserve anonymity):
> actorNetwork $nodes # A tibble: 522 x 3 id screen_name node_type <chr> <chr> <chr> 1 xxxxxxxxxxxxxxxxxxxxxxxxx xxxxxxxxxxxxxx actor 2 xxxxxxxxxxxxxxxxxxxxxxxxx xxxxxxxxxxxxx actor [snip] # … with 512 more rows $edges # A tibble: 604 x 6 from to video_id comment_id edge_type vosonTxt_comment <chr> <chr> <chr> <chr> <chr> <chr> 1 xxxxxxxx… VIDEOID… pJ_NyEY… xxxxxxxxxxx… comment "xxxxx" 2 xxxxxxxx… VIDEOID… pJ_NyEY… xxxxxxxxxxx… comment "xxxxx" [snip] # … with 594 more rows attr(,"class") [1] "list" "network" "actor" "youtube" "voson_text"
Note that in the above, AddText() was used to add the comment text data to the network dataframe, stored as an edge
attribute. Also, note that there is an optional parameter replies_from_text that can be passed to AddText() when
used with YouTube network creation, to extract the "reply to reply" comments.
This list is then passed to Graph(), which returns an igraph graph object. Remember that it is possible to achieve
the above using a single line of code:
actorGraph <- youtubeData |> Create("actor") |> AddText(youtubeData) |> Graph()
The following is an an annonymised summary of the igraph graph object.
> actorGraph IGRAPH 79e5456 DN-- 522 604 -- + attr: type (g/c), name (v/c), screen_name (v/c), node_type (v/c), | label (v/c), video_id (e/c), comment_id (e/c), edge_type (e/c), | vosonTxt_comment (e/c) + edges from 79e5456 (vertex names): [1] xxxx->VIDEOID:pJ_NyEYRkLQ [2] xxxx->VIDEOID:pJ_NyEYRkLQ [snip] + ... omitted several edges
The YouTube actor network node contains a graph attribute type (set to "youtube"). The node attributes are: name
(Channel ID, which is YouTube's unique user ID), screen_name (the users displayed name), node_type ('actor' or
'video') and label (a concatenation of the ID and screen name). The edge attributes are: video_id (the ID of the
video for which the data have been collected), comment_id (the ID of the comment), edge_type (whether the edge is a
'comment' i.e. top-level comment, 'reply-comment' i.e. reply to top-level comment or reply to reply or 'self-loop',
which is a special edge connecting the video to itself, as a means of including text posted with the video). In the
above example, because of our earlier use of AddText(), there is also an edge attribute vosonTxt_comment which is
the text associated with the comment, reply or video.
The example YouTube actor network contains 522 nodes and 604 edges. The following indicates that there were 500
top-level comments (we constrained the collection to this number), 103 replies to top-level comments (note: we did not
use AddText() to collect replies embedded within the text), and there is the single self-loop from the video to
itself.
> table(E(actorGraph)$edge_type) comment reply-comment self-loop 500 103 1
We can visualize this network, using red to identify the video nodes.
# change color of nodes with type video to red and others grey V(actorGraph)$color <- ifelse( V(actorGraph)$node_type == "video", "red", "grey" ) # open and write plot to a png file png("youtube_actor.png", width = 600, height = 600) plot(actorGraph, vertex.label = "", vertex.size = 4, edge.arrow.size = 0.5) dev.off()
The following creates a sub-network containing only the replies to top-level comments. In removing the other edges (top-level comments and the self-loop) we create a number isolate nodes (nodes with no connections) that we also remove. We have also used red to indicate the people who have written comments containing particular terms that have been present in the online commentary about the bushfires.
# removed edges that are not of type reply-comment g2 <- delete.edges( actorGraph, which(E(actorGraph)$edge_type != "reply-comment") ) # check number of isolates > length(which(degree(g2) == 0)) [1] 417 # remove isolates g2 <- delete.vertices(g2, which(degree(g2) == 0)) # get node indexes for the tails of edges that have comments containing # words of interest change the indexed node colors to red and others grey V(g2)$color <- "grey" ind <- tail_of( actorGraph, grep("arson|backburn|climate change", tolower(E(g2)$vosonTxt_comment)) ) V(g2)$color[ind] <- "red" # open and write plot to a png file png("youtube_actor_reply.png", width = 600, height = 600) plot(g2, vertex.label = "", vertex.size = 4, edge.arrow.size = 0.5) dev.off()
Finally, the AddVideoData() function supplements the network data with additional video information.
actorNetwork_withVideoInfo <- actorNetwork |> AddVideoData(youtubeAuth)
AddVideoData() returns a named list containing three dataframes named "nodes" (identical to the dataframe contained in
the list actorNetwork in the example able), "edges" (this has three additional columns: "video_title",
"video_description", "video_published_at") and a new dataframe "videos" (the following has been modified to preserve
anonymity):
> actorNetwork_withVideoInfo $nodes # A tibble: 522 x 3 id screen_name node_type <chr> <chr> <chr> 1 xxxxxxxxxxxxxxxxxxxxxxxx xxxxxxxxxxxxx actor 2 xxxxxxxxxxxxxxxxxxxxxxxx xxxxxxxxxxxxx actor [snip] # … with 512 more rows $edges # A tibble: 604 x 9 from to video_id comment_id edge_type vosonTxt_comment video_title <chr> <chr> <chr> <chr> <chr> <chr> <chr> 1 xxxx… xxxx… pJ_NyEY… xxxxxxxxx… comment xxxxxxxxxxxx … Australia … 2 xxxx… xxxx… pJ_NyEY… xxxxxxxxx… comment "xxxx" Australia … [snip] # … with 594 more rows, and 2 more variables: video_description <chr>, # video_published_at <chr> $videos # A tibble: 1 x 6 VideoID VideoTitle VideoDescription VideoPublishedAt ChannelID ChannelTitle <chr> <chr> <chr> <chr> <chr> <chr> 1 pJ_NyEY… Australia … "As Australia ba… 2020-01-05T12:3… UCknLrEd… DW News attr(,"class") [1] "list" "network" "actor" "youtube" [5] "voson_text" "voson_video_data"
It should also be noted that AddVideoData() can optionally substitute references to the video ID in the "nodes" and
"edges" dataframes with the video publishers channel ID (this is done by setting the parameter actorSubOnly to TRUE.
Activity Network
In the YouTube activity network, nodes are either comments or videos (videos represent a starting comment).
activityNetwork <- youtubeData |> Create("activity") |> AddText(youtubeData) activityGraph <- activityNetwork |> Graph()
Create("activity") returns a named list containing two dataframes named "nodes" and "edges" (the following has been
modified to preserve anonymity).
> activityNetwork $edges # A tibble: 603 x 3 from to edge_type <chr> <chr> <chr> 1 xxxxxxxxxxxxxxxxxxxxxxxxxx VIDEOID:pJ_NyEYRkLQ comment 2 xxxxxxxxxxxxxxxxxxxxxxxxxx VIDEOID:pJ_NyEYRkLQ comment [snip] # … with 593 more rows $nodes # A tibble: 604 x 8 id video_id published_at updated_at author_id screen_name node_type <chr> <chr> <chr> <chr> <chr> <chr> <chr> 1 xxxx… pJ_NyEY… 2020-01-10T… 2020-01-1… xxxxxxxx… xxxxxxxxxx… comment 2 xxxx… pJ_NyEY… 2020-01-09T… 2020-01-0… xxxxxxxx… xxxxxxxxxx… comment [snip] # … with 594 more rows, and 1 more variable: vosonTxt_comment <chr> attr(,"class") [1] "list" "network" "activity" "youtube" "voson_text"
Note that in the above, AddText() was used to add the comment text data to the network dataframe, stored as a node
attribute. This list is then passed to Graph(), which returns an igraph graph object (this has been anonymised).
IGRAPH 02664d1 DN-- 604 603 -- + attr: type (g/c), name (v/c), video_id (v/c), published_at (v/c), | updated_at (v/c), author_id (v/c), screen_name (v/c), node_type | (v/c), vosonTxt_comment (v/c), label (v/c), edge_type (e/c) + edges from 02664d1 (vertex names): [1] xxxx->VIDEOID:pJ_NyEYRkLQ [2] xxxx->VIDEOID:pJ_NyEYRkLQ [3] xxxx->VIDEOID:pJ_NyEYRkLQ [4] xxxx->VIDEOID:pJ_NyEYRkLQ [5] xxxx->VIDEOID:pJ_NyEYRkLQ [6] xxxx->VIDEOID:pJ_NyEYRkLQ + ... omitted several edges
The YouTube activity network contains a graph attribute type (set to "youtube"). The node attributes are: name
(character string ID number for the comment or video), video_id (character string ID of the video for which the
comments collected - in this example, "pJ_NyEYRkLQ"), published_at (timestamp of when the comment was published, this
is NA for the video itself), updated_at (timestamp of when a comment was updated), author_id (user's Channel ID),
screen_name (user's display name), node_type (whether the node is a 'comment' i.e. top-level comment,
'reply-comment' i.e. reply to top-level comment or reply to reply or 'video'), vosonText_comment (the comment text,
NA for the video), label (concatenation of name and screen_name). The edge attributes edge_type which is
'comment' for all edges connecting a top-level comment to the video, and 'reply-comment' for all other edges.
The example YouTube activity network contains 604 nodes and 603 edges. The following is an igraph visualization of the
network, where the video is indicated by a red node, and blue indicates comments that include one of the following
terms: "arson", "bakcburn", "climate change".
# set all video node colors to red and others to grey V(activityGraph)$color <- "grey" V(activityGraph)$color[which(V(activityGraph)$node_type == "video")] <- "red" # get node indexes of comments that contain terms of interest # set their node colors to blue ind <- grep( "arson|backburn|climate change", tolower(V(activityGraph)$vosonTxt_comment) ) V(activityGraph)$color[ind] <- "blue" # open and write plot to a png file png("youtube_activity.png", width = 600, height = 600) plot(activityGraph, vertex.label = "", vertex.size = 4, edge.arrow.size = 0.5) dev.off()
The Reddit collection in vosonSML is based on the approach used in the
RedditExtractoR package.
Authenticating with the Reddit API
The vosonSML does not require Reddit API credentials to be provided. However, to keep the workflow consistent with the
other data sources, we still need to create a "dummy" access token, using the Authenticate() function (see below).
Collecting Data from Reddit
To collect Reddit comment data, first construct a character vector containing the post URL(s).
myThreadUrls <- c( "https://www.reddit.com/r/xxxxxx/comments/xxxxxx/x_xxxx_xxxxxxxxx/", "https://www.reddit.com/r/xxxxxx/comments/xxxxxx/x_xxxx_xxxxxxxxx/" )
This character vector is then passed as an argument to the Collect() function. In the example below, a post relating
to the politics around the Australian bushfires was used:
https://www.reddit.com/r/worldnews/comments/elcb9b/australias_leaders_deny_link_between_climate/. This post was created
on 7th January 2020 and by the time of data collection (10th January), it had attracted over 4000 comments. The maximum
number of comments available for retrieval is 500 per thread or post.
Reddit has implemented a feature in their latest site re-design to branch off into new threads, when a thread reaches a
breadth (diameter) of 10 comments. These appear as 'Continue this thread' links in thread discussions on the reddit
site, and as new listing markers within the collected thread data. vosonSML follows these links with additional thread
requests and collects comments from those as well, capturing a more complete data set, as the limit of 500 comments
applies to each 'new' thread.
myThreadUrls <- "https://www.reddit.com/r/worldnews/comments/elcb9b/australias_leaders_deny_link_between_climate/" redditData <- Authenticate("reddit") |> Collect(threadUrls = myThreadUrls, writeToFile = TRUE)
The Collect() function takes the following arguments (when used for collecting Reddit data): credential (an object
generated from Authenticate() with class name "reddit" (above we pass this via the pipe), threadUrls (character
vector of Reddit thread urls), waitTime (a numeric vector giving the time range in seconds to select random wait url
collection requests; default is c(3, 10) i.e. random wait between 3 and 10 seconds), ua (User-Agent string; default
is option("HTTPUserAgent") as set by vosonSML, writeToFile (whether to write the returned dataframe to file as an
.rds file; default is FALSE), verbose (whether to output information about the data collection; default is TRUE).
The Collect() function returns a tibble dataframe (this output has been anonymised):
> str(redditData) Classes ‘tbl_df’, ‘tbl’, ‘datasource’, ‘reddit’ and 'data.frame': 767 obs. of 22 variables: $ id : int 1 2 3 4 5 6 7 8 9 10 ... $ structure : chr "1" "4_1_1_1_1_1_1_1_1_1" "4_1_1_4_2_1_1_1_1_1" ... $ post_date : chr "2020-01-07 14:34:58" "2020-01-07 14:34:58" ... $ post_date_unix : num 1.58e+09 1.58e+09 1.58e+09 1.58e+09 1.58e+09 ... $ comm_id : chr "xxxx" "xxxx" "xxxx" "xxxx" ... $ comm_date : chr "2020-01-07 19:11:10" "2020-01-07 21:04:05" ... $ comm_date_unix : num 1.58e+09 1.58e+09 1.58e+09 1.58e+09 1.58e+09 ... $ num_comments : int 4435 4435 4435 4435 4435 4435 4435 4435 4435 4435 ... $ subreddit : chr "worldnews" "worldnews" "worldnews" "worldnews" ... $ upvote_prop : num 0.91 0.91 0.91 0.91 0.91 0.91 0.91 0.91 0.91 0.91 ... $ post_score : int 45714 45714 45714 45712 45714 45710 45720 45712 .. $ author : chr "xxxx" "xxxx" "xxxx" "xxxx" ... $ user : chr "xxxx" "xxxx" "xxxx" "xxxx" ... $ comment_score : int 1904 136 17 13 9 9 125 4 6 12 ... $ controversiality: int 0 0 0 0 0 0 0 0 0 0 ... $ comment : chr "xxxx... $ title : chr "Australia’s leaders deny link between climate change and the country’s devastating bushfires" "Australia’s leaders deny link between climate change and the country’s devastating bushfires" "Australia’s leaders deny link between climate change and the country’s devastating bushfires" "Australia’s leaders deny link between climate change and the country’s devastating bushfires" ... $ post_text : chr "" "" "" "" ... $ link : chr "https://www.theglobeandmail.com/world/article-australias-leaders-unmoved-on-climate-action-after-devastating-2/" "https://www.theglobeandmail.com/world/article-australias-leaders-unmoved-on-climate-action-after-devastating-2/" "https://www.theglobeandmail.com/world/article-australias-leaders-unmoved-on-climate-action-after-devastating-2/" "https://www.theglobeandmail.com/world/article-australias-leaders-unmoved-on-climate-action-after-devastating-2/" ... $ domain : chr "theglobeandmail.com" "theglobeandmail.com" "theglobeandmail.com" "theglobeandmail.com" ... $ url : chr "https://www.reddit.com/r/worldnews/comments/elcb9b/australias_leaders_deny_link_between_climate/" "https://www.reddit.com/r/worldnews/comments/elcb9b/australias_leaders_deny_link_between_climate/" "https://www.reddit.com/r/worldnews/comments/elcb9b/australias_leaders_deny_link_between_climate/" "https://www.reddit.com/r/worldnews/comments/elcb9b/australias_leaders_deny_link_between_climate/" ... $ thread_id : chr "elcb9b" "elcb9b" "elcb9b" "elcb9b" ...
Importing saved collection data from file
If you are reading a previously saved writeToFile Reddit dataframe from disk, you simply need to use the readRDS
function.
redditData <- readRDS("2020-09-26_095354-RedditData.rds")
Creating Reddit Networks
It is currently possible to create two types of networks using Reddit data: (1) actor network and (2) activity network.
Actor Network
In the Reddit actor network, nodes represent users who have posted original posts and comments and the edges are the interactions between users in the comments i.e. where there is an edge from user i to user j if i writes a comment that replies to user j's comment (or the original post).
The following creates a Reddit actor network with comment text as an edge attribute (as above, this can be achieved in a single line of code, but we split it into two lines to better explain the objects that are created).
actorNetwork <- redditData |> Create("actor") |> AddText(redditData) actorGraph <- actorNetwork |> Graph(writeToFile = TRUE)
Create("actor") returns a named list containing two dataframes named "nodes" and "edges" (the following has been
modified to preserve anonymity):
> actorNetwork $nodes # A tibble: 439 x 2 id user <int> <chr> 1 1 xxxxxxxxxx 2 2 xxxxxxxxxxxxxx [snip] # … with 429 more rows $edges # A tibble: 768 x 8 from to subreddit thread_id comment_id comm_id vosonTxt_comment title <int> <int> <chr> <chr> <dbl> <chr> <chr> <chr> 1 1 439 worldnews elcb9b 1 xxxxxxx "xxxxxxxxxxxxxxxxxxx NA 2 2 73 worldnews elcb9b 2 xxxxxxx "xxxxxxxxxxxxxxxxxxx NA [snip] … with 758 more rows attr(,"class") [1] "list" "network" "actor" "reddit" "voson_text"
Note that in the above, AddText() was used to add the comment text data to the network dataframe, stored as an edge
attribute. This list is then passed to Graph(), which returns an igraph graph object.
> actorGraph IGRAPH 5a5d5b9 DN-- 439 768 -- + attr: type (g/c), name (v/c), user (v/c), label (v/c), subreddit | (e/c), thread_id (e/c), comment_id (e/n), comm_id (e/c), | vosonTxt_comment (e/c), title (e/c) + edges from 5a5d5b9 (vertex names): [1] 1 ->439 2 ->73 3 ->113 4 ->120 5 ->120 6 ->17 7 ->194 8 ->20 9 ->20 [10] 10->165 11->165 12->1 13->2 14->3 15->4 16->5 17->6 18->7 [19] 19->8 20->9 21->10 22->11 23->12 2 ->13 24->3 7 ->18 25->23 [28] 26->2 3 ->24 27->18 28->1 29->2 18->27 1 ->28 30->2 31->7 [37] 25->1 32->2 33->31 34->1 2 ->32 35->7 25->34 36->2 7 ->35 [46] 37->1 38->2 39->7 40->1 41->2 42->7 43->1 2 ->41 44->7 + ... omitted several edges
The Reddit actor network contains a graph attribute type (set to "reddit"). The node attributes are: name
(sequential ID number for actor, generated by vosonSML), user (Reddit handle or screen name)) and label (a
concatenation of the ID and screen name). The edge attributes are: subreddit (the subreddit from which the post is
collected), thread_id (the 6 character ID of the thread or post), comment_id (sequential ID number for comment,
generated by vosonSML). There is also an edge attribute title, which is set to NA for all comments except the
comment representing the original post. Further note that the original post is represented as a self-loop edge from the
user who authored the post (and this is how the post text can be accessed, as an edge attribute), however with the
Reddit actor network, there is no edge_type attribute. Finally, because we used AddText() in the above example,
there is also an edge attribute vosonTxt_comment which is the text associated with the comment, or original post.
The example Reddit actor network contains 439 nodes and 768 edges. The following is a visualization of the actor network, where the author of the post is indicated by a red node, and blue nodes indicate those people who mentioned "arson" or "starting fires" in at least one of their comments.
# set node color of original post to red based on presence of title edge # attribute set other node colors to grey V(actorGraph)$color <- "grey" V(actorGraph)$color[tail_of( actorGraph, which(!is.na(E(actorGraph)$title)) )] <- "red" # get node indexes for the tails of edges that have comments containing # words of interest set their node colors to blue ind <- tail_of( actorGraph, grep("arson|starting fires", tolower(E(actorGraph)$vosonTxt_comment)) ) V(actorGraph)$color[ind] <- "blue" # open and write plot to a png file png("reddit_actor.png", width = 600, height = 600) plot(actorGraph, vertex.label = "", vertex.size = 4, edge.arrow.size = 0.5) dev.off()
Activity Network
In the Reddit activity network, nodes are either comments and/or initial thread posts and the edges represent replies to the original post, or replies to comments.
activityNetwork <- redditData |> Create("activity") |> AddText(redditData) activityGraph <- activityNetwork |> Graph(writeToFile = TRUE)
Create("activity") returns a named list containing two dataframes named "nodes" and "edges" (the following has been
modified to preserve anonymity):
> activityNetwork $nodes # A tibble: 768 x 10 id thread_id comm_id datetime ts subreddit user node_type <chr> <chr> <chr> <chr> <dbl> <chr> <chr> <chr> 1 elcb… elcb9b xxxxxxx 2020-01… 1.58e9 worldnews xxxx… comment 2 elcb… elcb9b xxxxxxx 2020-01… 1.58e9 worldnews xxxx… comment [snip] # … with 758 more rows, and 2 more variables: vosonTxt_comment <chr>, # title <chr> $edges # A tibble: 767 x 3 from to edge_type <chr> <chr> <chr> 1 elcb9b.1 elcb9b.0 comment 2 elcb9b.4_1_1_1_1_1_1_1_1_1 elcb9b.4_1_1_1_1_1_1_1_1 comment [snip] # … with 757 more rows attr(,"class") [1] "list" "network" "activity" "reddit" "voson_text"
Note that in the above, AddText() was used to add the comment text data to the network dataframe, stored as a node
attribute. This list is then passed to Graph(), which returns an igraph graph object.
> activityGraph IGRAPH 09e30ea DN-- 768 767 -- + attr: type (g/c), name (v/c), thread_id (v/c), comm_id (v/c), | datetime (v/c), ts (v/n), subreddit (v/c), user (v/c), node_type | (v/c), vosonTxt_comment (v/c), title (v/c), label (v/c), edge_type | (e/c) + edges from 09e30ea (vertex names): [1] elcb9b.1 ->elcb9b.0 [2] elcb9b.4_1_1_1_1_1_1_1_1_1->elcb9b.4_1_1_1_1_1_1_1_1 [3] elcb9b.4_1_1_4_2_1_1_1_1_1->elcb9b.4_1_1_4_2_1_1_1_1 [4] elcb9b.4_1_1_4_3_1_1_1_3_1->elcb9b.4_1_1_4_3_1_1_1_3 [5] elcb9b.4_1_1_4_3_1_1_1_3_2->elcb9b.4_1_1_4_3_1_1_1_3 + ... omitted several edges
The Reddit activity network contains a graph attribute type (set to "reddit"). The node attributes are: name (string
showing position of the comment in the thread), date (date when the comment was authored, in DD-MM-YY format),
subreddit (the subreddit from which the post is collected), user (Reddit handle or screen name of the user who
authored the comment or post), node_type ('comment' or 'thread'), title (NA for all nodes except that representing
the original post), label (a concatenation of name and user). Because we used AddText() in the above example,
there is also a node attribute vosonTxt_comment which is the text from the comment, or original post. The edge
attributes is edge_type which is 'comment' for all edges.
The example Reddit activity network contains 768 nodes and 767 edges. The following is a visualisation of the network, where the post is indicated by a red node, and blue indicates those comments that include the words "arson" or "starting fires".
# set original post node colors to red based on a node type of thread # set other node colors to grey V(activityGraph)$color <- "grey" V(activityGraph)$color[which(V(activityGraph)$node_type == "thread")] <- "red" # get node indexes for nodes that have comment attributes containing words of interest # set their node colors to blue ind <- grep("arson|starting fires", tolower(V(activityGraph)$vosonTxt_comment)) V(activityGraph)$color[ind] <- "blue" # open and write plot to a png file png("reddit_activity.png", width = 600, height = 600) plot(activityGraph, vertex.label = "", vertex.size = 4, edge.arrow.size = 0.5) dev.off()
Merging Collected Data
Data that was collected at different times, used different collect parameters or was saved to multiple files can be
merged by using functions that operate on dataframes. The data from Collect is output in tibble (dataframe) format
and provided each collected data set are from the same social media type can be combined using the rbind function.
In the examples below or cases that involve large datasets, it can sometimes be more efficient or timely to substitute
optimized functions such as dplyr::bind_rows for rbind or data.table::rbindlist instead of do.call("rbind",
list).
Merging from multiple Collect operations
Data collected in the same session can be merged using the Merge function. The following twitter example combines
tweet data collected using different search parameters. The result is combined most recent tweets using the #auspol
hashtag and most popular tweets using the #bushfire hashtag.
# collect twitter data for the #auspol hashtag auspolTwitterData <- twitterAuth |> Collect(searchTerm = "#auspol", searchType = "recent", numTweets = 100) # collect twitter data for the #bushfire hashtag bushfireTwitterData <- twitterAuth |> Collect(searchTerm = "#bushfire", searchType = "popular", numTweets = 50) # combine the collected data for the different hashtags twitterData <- Merge(auspolTwitterData, bushfireTwitterData, writeToFile = TRUE)
Merging files in a directory
If there are many data collections to be merged from file vosonSML has a MergeFiles function. In this example a list
of twitter collection files in the 2019TwitterBushfireData directory that end in "TwitterData.rds" are merged
together.
twitterData <- MergeFiles( "2019TwitterBushfireData", pattern = "*TwitterData.rds" )
Creating a network and graph from merged data
Once the data is merged then it can then simply be passed to the Create function to create a network as per the usual
vosonSML work flow.
# create an igraph of twitter actor network actorGraph <- twitterData |> Create("actor") |> Graph(writeToFile = TRUE)
VOSON Dashboard
It is possible to import a network created using vosonSML, and saved as a ".graphml" file, into VOSON Dashboard.
However, if you have created a categorical node attribute in the network and wish to plot networks in VOSON Dashboard
with node colour reflecting the node attribute, then the node attribute name has to be pre-pended with "vosonCA_". This
let's VOSON Dashboard know the attribute is to be treated as categorical.
Above, we created a Twitter subnetwork: the giant component in the reply network, with red nodes indicating those users
who tweeted using the word "bushfire". We did this by created a node attribute "tweetedBushfires". For VOSON
Dashboard to recognise this node attribute, it has to be named "vosonCA_tweetedBushfires". The following code creates
a new node attribute with this name, and sames the network as a graphml file:
V(g3)$vosonCA_tweetedBushfires <- V(g3)$tweetedBushfires write.graph(g3, "g3.graphml", format = "graphml")
The following shows a screenshot of VOSON Dashboard with this network loaded and the "tweetedBushfires" attribute has
been seleced to be reflected in the node colour.
Acknowledgements
vosonSML and VOSON Dashboard are developed and maintained at the Virtual Observatory for the Study of Online Networks (VOSON) Lab at the Australian National University.
vosonSML was originally released on CRAN in November 2015 as the package SocialMediaLab (Timothy Graham was the lead
developer), with the significantly revised and renamed vosonSML being released on CRAN in July 2018 (Bryan Gertzel is
the lead developer).
We acknowledge the contributions of Chung-hong Chan who implemented a revised UI (involving magrittr pipes) in the
original SocialMediaLab package and Xiaolan Cai who has contributed to documentation.
Try the vosonSML package in your browser
Any scripts or data that you put into this service are public.
R Package Documentation
Browse R Packages
We want your feedback!
Note that we can't provide technical support on individual packages. You should contact the package authors for that.
Embedding an R snippet on your website
Add the following code to your website.
For more information on customizing the embed code, read Embedding Snippets.