cols_merge_n_pct: Merge two columns to combine counts and percentages
In gt: Easily Create Presentation-Ready Display Tables
cols_merge_n_pct R Documentation
Merge two columns to combine counts and percentages
Description
cols_merge_n_pct() is a specialized variant of cols_merge(),
It operates by taking two columns that constitute both a count (col_n) and
a fraction of the total population (col_pct) and merges them into a single
column. What results is a column containing both counts and their associated
percentages (e.g., 12 (23.2%)). The column specified in col_pct is
dropped from the output table.
Usage
cols_merge_n_pct(data, col_n, col_pct, rows = everything(), autohide = TRUE)
Arguments
data
The gt table or gt group data object
obj:<gt_tbl> // required
This is the gt table object that is commonly created through use of the
gt() function.
OR
obj:<gt_group> // required
This is the gt group object that is commonly created through use of the
gt_group() function.
col_n
Column to target for counts
<column-targeting expression> // required
The column that contains values for the count component. While select
helper functions such as starts_with() and ends_with() can be used for
column targeting, it's recommended that a single column name be used. This
is to ensure that exactly one column is provided here.
col_pct
Column to target for percentages
<column-targeting expression> // required
The column that contains values for the percentage component. While select
helper functions such as starts_with() and ends_with() can be used for
column targeting, it's recommended that a single column name be used. This
is to ensure that exactly one column is provided here. This column should
be formatted such that percentages are displayed (e.g., with
fmt_percent()).
rows
Rows to target
<row-targeting expression> // default: everything()
In conjunction with columns, we can specify which of their rows should
participate in the merging process. The default everything() results in
all rows in columns being formatted. Alternatively, we can supply a
vector of row IDs within c(), a vector of row indices, or a select
helper function (e.g. starts_with(), ends_with(), contains(),
matches(), num_range(), and everything()). We can also use
expressions to filter down to the rows we need
(e.g., [colname_1] > 100 & [colname_2] < 50).
autohide
Automatic hiding of the col_pct column
scalar<logical> // default: TRUE
An option to automatically hide the column specified as col_pct. Any
columns with their state changed to hidden will behave the same as before,
they just won't be displayed in the finalized table.
Value
An object of class gt_tbl.
Comparison with other column-merging functions
This function could be somewhat replicated using cols_merge(), however,
cols_merge_n_pct() employs the following specialized semantics for NA
and zero-value handling:
-
NAs in col_n result in missing values for the merged
column (e.g., NA + 10.2% = NA)
-
NAs in col_pct (but not col_n) result in
base values only for the merged column (e.g., 13 + NA = 13)
-
NAs both col_n and col_pct result in
missing values for the merged column (e.g., NA + NA = NA)
If a zero (0) value is in col_n then the formatted output will be
"0" (i.e., no percentage will be shown)
Any resulting NA values in the col_n column following the merge
operation can be easily formatted using sub_missing().
Separate calls of sub_missing() can be used for the col_n and
col_pct columns for finer control of the replacement values. It is the
responsibility of the user to ensure that values are correct in both the
col_n and col_pct columns (this function neither generates nor
recalculates values in either). Formatting of each column can be done
independently in separate fmt_number() and fmt_percent() calls.
This function is part of a set of four column-merging functions. The other
three are the general cols_merge() function and the specialized
cols_merge_uncert() and cols_merge_range() functions. These functions
operate similarly, where the non-target columns can be optionally hidden from
the output table through the hide_columns or autohide options.
Examples
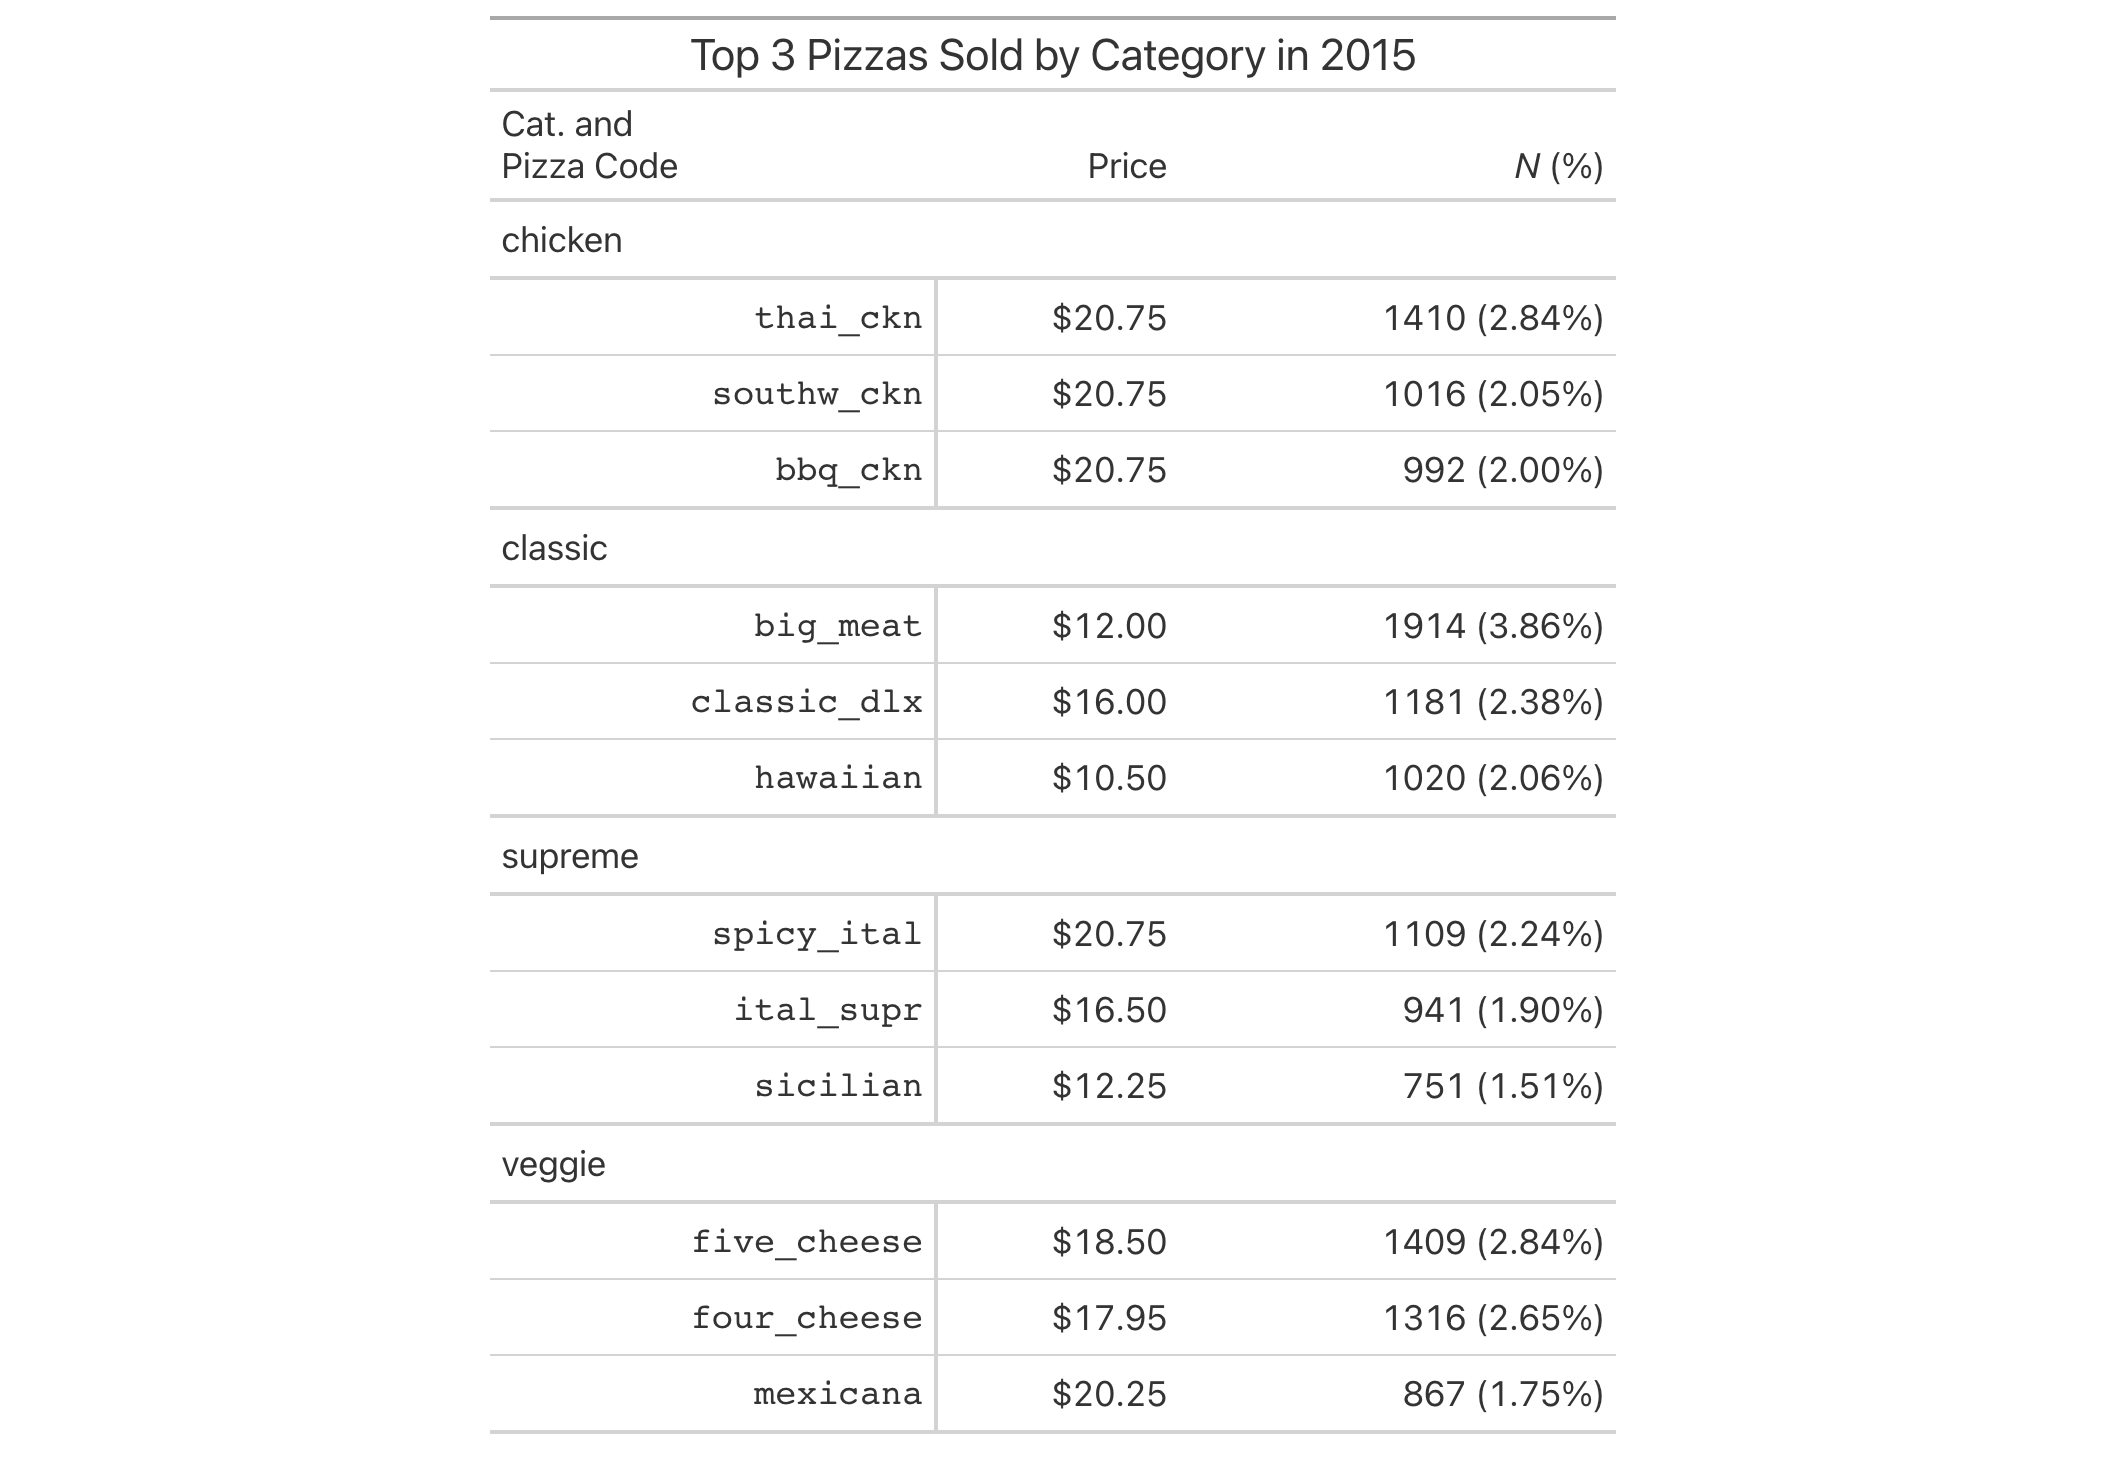
Using a summarized version of the pizzaplace dataset, let's create a
gt table that displays the counts and percentages of the top 3 pizzas
sold by pizza category in 2015. The cols_merge_n_pct() function is used to
merge the n and frac columns (and the frac column is formatted using
fmt_percent()).
pizzaplace |>
  dplyr::count(name, type, price, sort = TRUE) |>
  dplyr::mutate(frac = prop.table(n)) |>
  dplyr::slice_max(n, n = 3, by = type) |>
  dplyr::arrange(type) |>
  gt(
    rowname_col = "name",
    groupname_col = "type"
  ) |>
  fmt_currency(price) |>
  fmt_percent(frac) |>
  cols_merge_n_pct(
    col_n = n,
    col_pct = frac
  ) |>
  cols_label(
    n = md("*N* (%)"),
    price = "Price"
  ) |>
  tab_style(
    style = cell_text(font = "monospace"),
    locations = cells_stub()
  ) |>
  tab_stubhead(md("Cat. and  \nPizza Code")) |>
  tab_header(title = "Top 3 Pizzas Sold by Category in 2015") |>
  tab_options(table.width = px(512))
Function ID
5-17
Function Introduced
v0.3.0 (May 12, 2021)
See Also
Other column modification functions:
cols_add(),
cols_align(),
cols_align_decimal(),
cols_hide(),
cols_label(),
cols_label_with(),
cols_merge(),
cols_merge_range(),
cols_merge_uncert(),
cols_move(),
cols_move_to_end(),
cols_move_to_start(),
cols_nanoplot(),
cols_unhide(),
cols_units(),
cols_width()
gt documentation built on Jan. 22, 2026, 9:07 a.m.
R Package Documentation
Browse R Packages
We want your feedback!
Note that we can't provide technical support on individual packages. You should contact the package authors for that.
| cols_merge_n_pct | R Documentation |
Merge two columns to combine counts and percentages
Description
cols_merge_n_pct() is a specialized variant of cols_merge(),
It operates by taking two columns that constitute both a count (col_n) and
a fraction of the total population (col_pct) and merges them into a single
column. What results is a column containing both counts and their associated
percentages (e.g., 12 (23.2%)). The column specified in col_pct is
dropped from the output table.
Usage
cols_merge_n_pct(data, col_n, col_pct, rows = everything(), autohide = TRUE)
Arguments
data |
The gt table or gt group data object
This is the gt table object that is commonly created through use of the
OR
This is the gt group object that is commonly created through use of the
|
col_n |
Column to target for counts
The column that contains values for the count component. While select
helper functions such as |
col_pct |
Column to target for percentages
The column that contains values for the percentage component. While select
helper functions such as |
rows |
Rows to target
In conjunction with |
autohide |
Automatic hiding of the
An option to automatically hide the column specified as |
Value
An object of class gt_tbl.
Comparison with other column-merging functions
This function could be somewhat replicated using cols_merge(), however,
cols_merge_n_pct() employs the following specialized semantics for NA
and zero-value handling:
-
NAs incol_nresult in missing values for the merged column (e.g.,NA+10.2%=NA) -
NAs incol_pct(but notcol_n) result in base values only for the merged column (e.g.,13+NA=13) -
NAs bothcol_nandcol_pctresult in missing values for the merged column (e.g.,NA+NA=NA) If a zero (
0) value is incol_nthen the formatted output will be"0"(i.e., no percentage will be shown)
Any resulting NA values in the col_n column following the merge
operation can be easily formatted using sub_missing().
Separate calls of sub_missing() can be used for the col_n and
col_pct columns for finer control of the replacement values. It is the
responsibility of the user to ensure that values are correct in both the
col_n and col_pct columns (this function neither generates nor
recalculates values in either). Formatting of each column can be done
independently in separate fmt_number() and fmt_percent() calls.
This function is part of a set of four column-merging functions. The other
three are the general cols_merge() function and the specialized
cols_merge_uncert() and cols_merge_range() functions. These functions
operate similarly, where the non-target columns can be optionally hidden from
the output table through the hide_columns or autohide options.
Examples
Using a summarized version of the pizzaplace dataset, let's create a
gt table that displays the counts and percentages of the top 3 pizzas
sold by pizza category in 2015. The cols_merge_n_pct() function is used to
merge the n and frac columns (and the frac column is formatted using
fmt_percent()).
pizzaplace |>
dplyr::count(name, type, price, sort = TRUE) |>
dplyr::mutate(frac = prop.table(n)) |>
dplyr::slice_max(n, n = 3, by = type) |>
dplyr::arrange(type) |>
gt(
rowname_col = "name",
groupname_col = "type"
) |>
fmt_currency(price) |>
fmt_percent(frac) |>
cols_merge_n_pct(
col_n = n,
col_pct = frac
) |>
cols_label(
n = md("*N* (%)"),
price = "Price"
) |>
tab_style(
style = cell_text(font = "monospace"),
locations = cells_stub()
) |>
tab_stubhead(md("Cat. and \nPizza Code")) |>
tab_header(title = "Top 3 Pizzas Sold by Category in 2015") |>
tab_options(table.width = px(512))
Function ID
5-17
Function Introduced
v0.3.0 (May 12, 2021)
See Also
Other column modification functions:
cols_add(),
cols_align(),
cols_align_decimal(),
cols_hide(),
cols_label(),
cols_label_with(),
cols_merge(),
cols_merge_range(),
cols_merge_uncert(),
cols_move(),
cols_move_to_end(),
cols_move_to_start(),
cols_nanoplot(),
cols_unhide(),
cols_units(),
cols_width()
R Package Documentation
Browse R Packages
We want your feedback!
Note that we can't provide technical support on individual packages. You should contact the package authors for that.
Embedding an R snippet on your website
Add the following code to your website.
For more information on customizing the embed code, read Embedding Snippets.