README.md
In bernatgel/karyoploteR: Plot customizable linear genomes displaying arbitrary data


karyoploteR - An R/Biocondutor package to plot arbitrary data along the genome
Description
karyoploteR is an R package to
plot data along the genome using a karyotype style plot.
It is entirely based on R base graphics and inspired by the R base graphics API.
It includes functions to plot primitive graphic elements such as points, lines,
rectangles, text, etc mapped into the genome plot coordinates and higher
level functions to plot a heatmap, the regions in a GenomicRanges object
or the cumulative coverage of such regions.
Data positioning and track configuration has been inspired by Circos and does
not explicitly understands the concept of track. Thus, it is possible to freely specify
where to plot the data and to create plots with multiple independent tracks or
overlapping representations.
It is highly configurable and in addition to the parametrization of the
different data plotting functions, it is possible to specify custom functions
for every plotting action from the basic chromosome bands to the chromosome labels
or base numbers as well as creating completely new plotting functions.
How to use it
Documentation (vignette and user manual) is available at the karyoploteR's
Bioconductor landing page at http://bioconductor.org/packages/karyoploteR
Tutorial and Examples
In addition to the documentation above, a short tutorial and some examples can be found at https://bernatgel.github.io/karyoploter_tutorial/
Citing karyoploteR
karyoploteR has been developed by Bernat Gel and Eduard Serra at IGTP
Hereditary Cancer Group.
If you use karyoploteR in your research, please cite the Bioinformatics paper describing it:
Bernat Gel & Eduard Serra. (2017). karyoploteR: an R/Bioconductor package to plot customizable genomes displaying arbitrary data. Bioinformatics, 31–33. doi:10.1093/bioinformatics/btx346
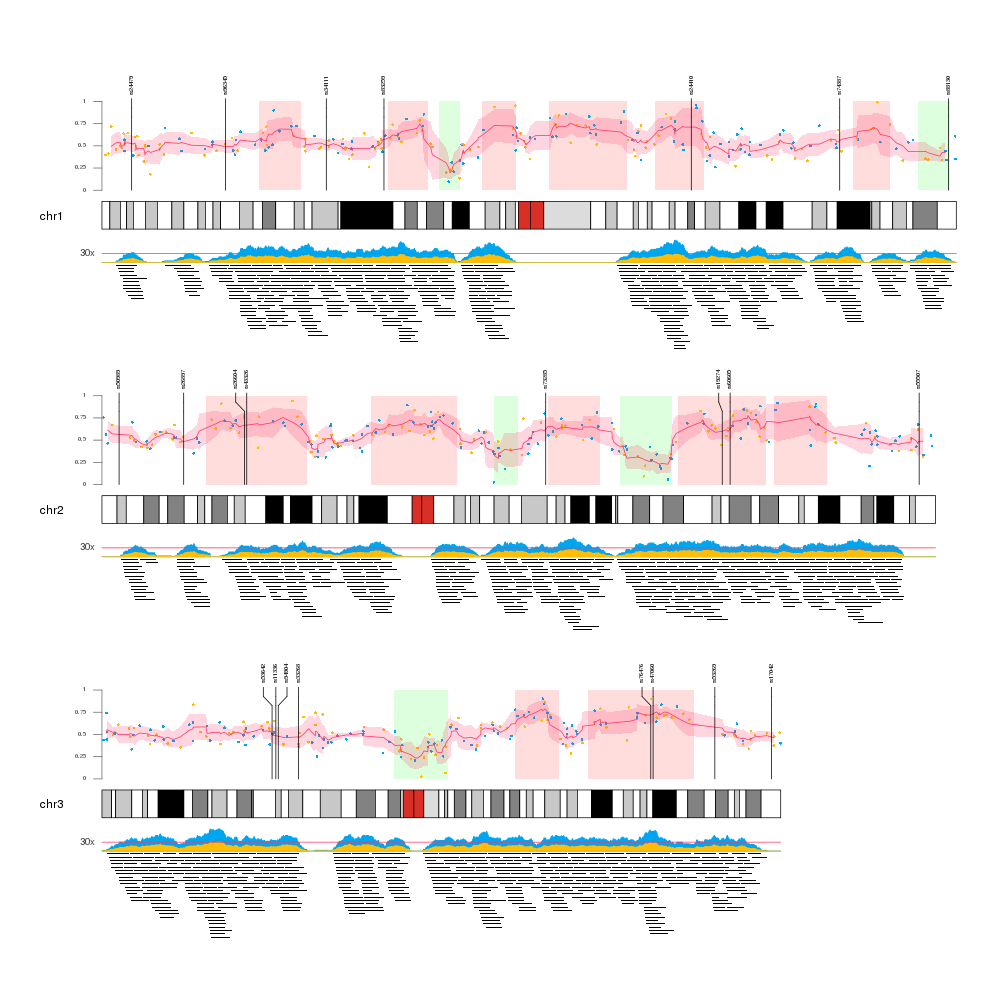
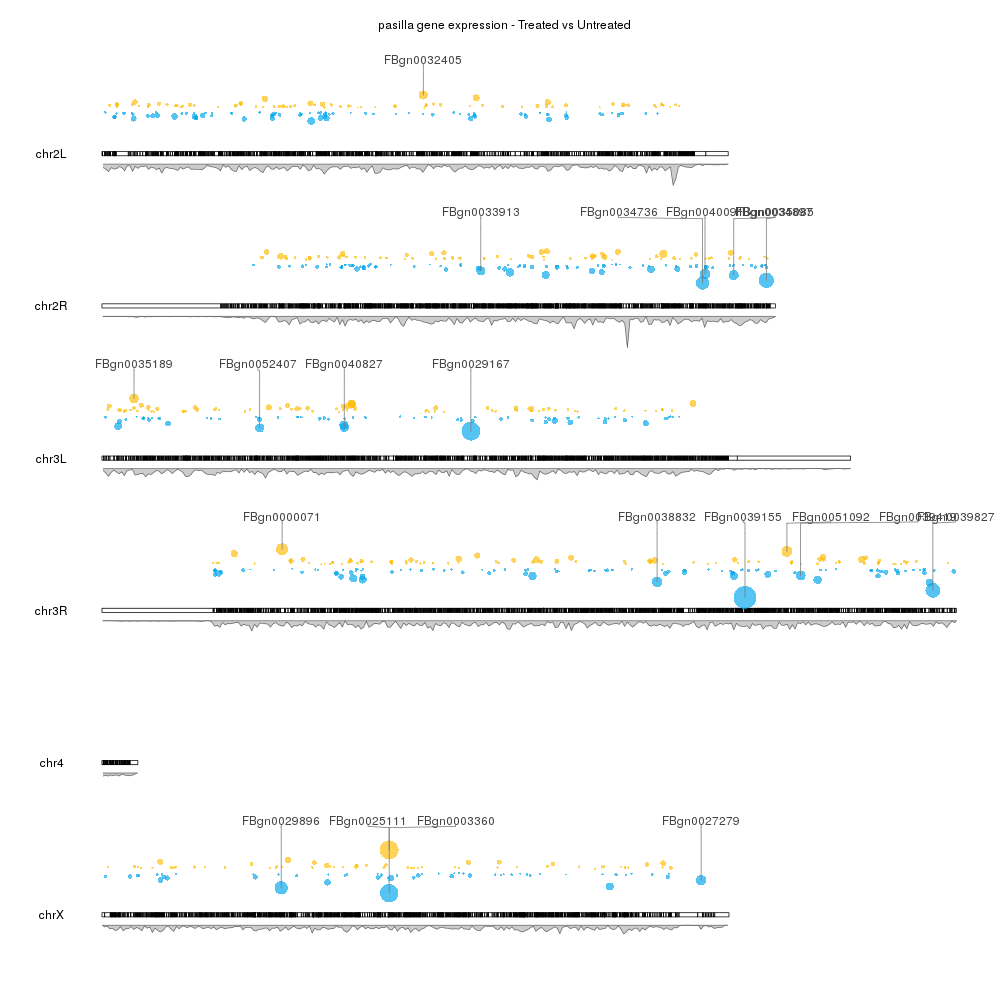
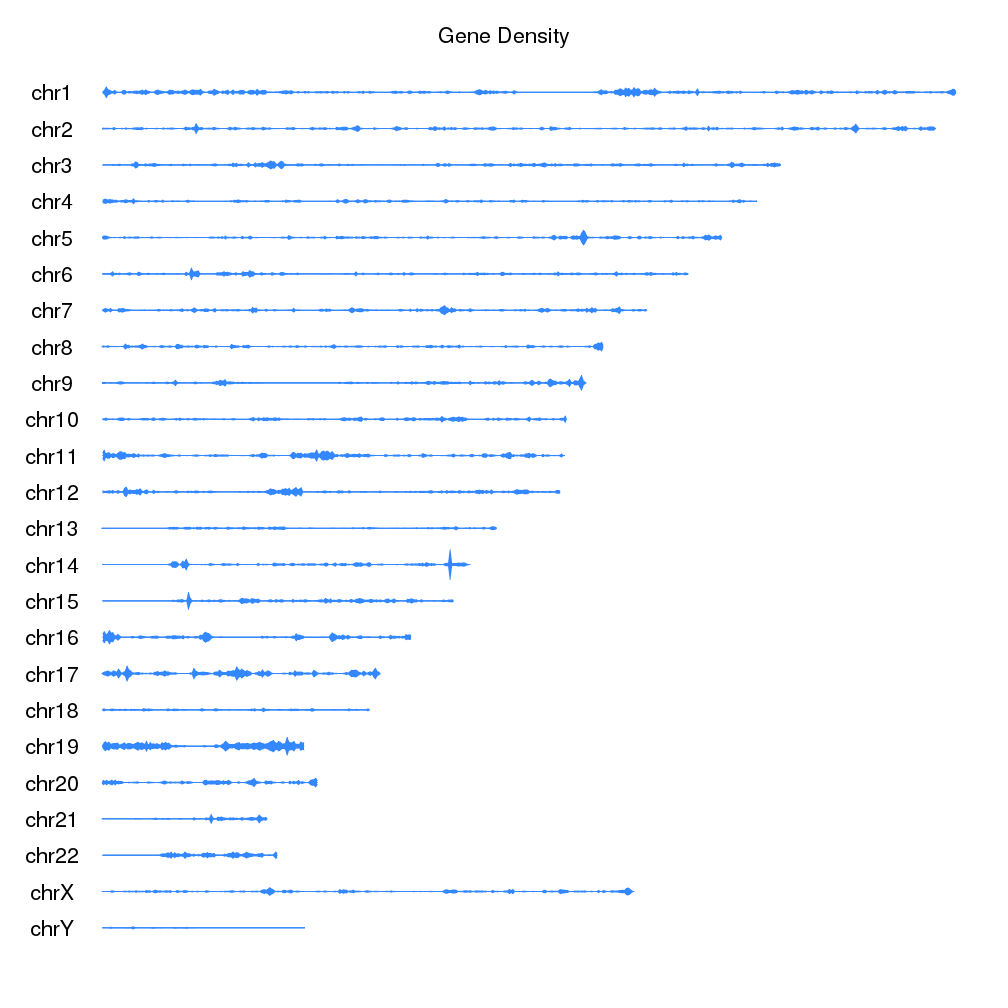
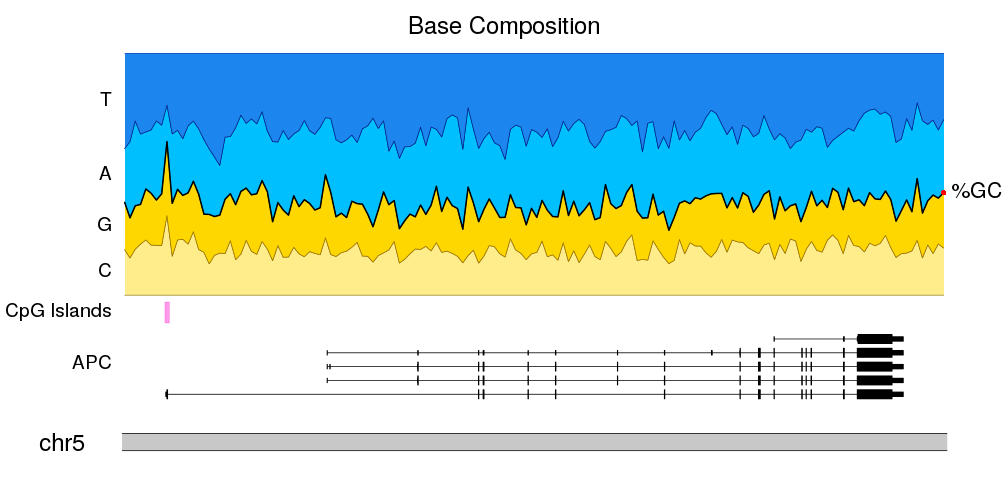
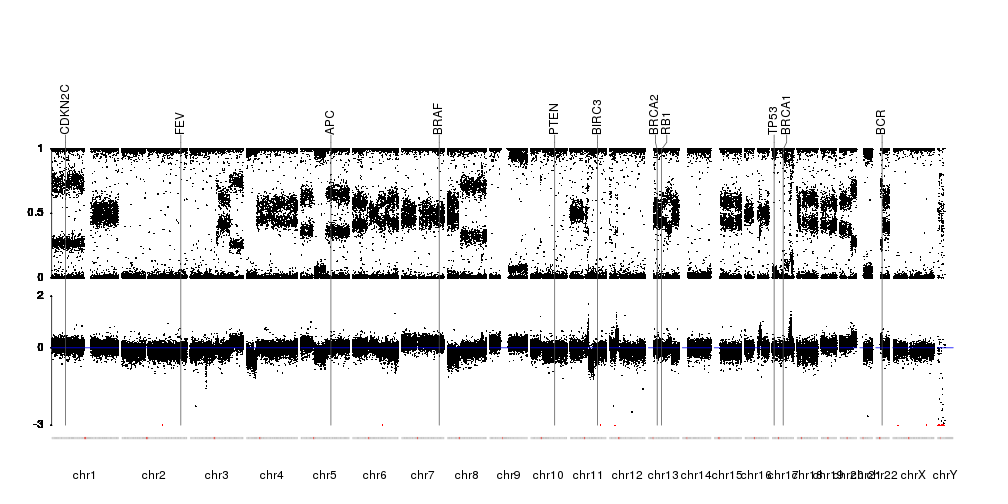
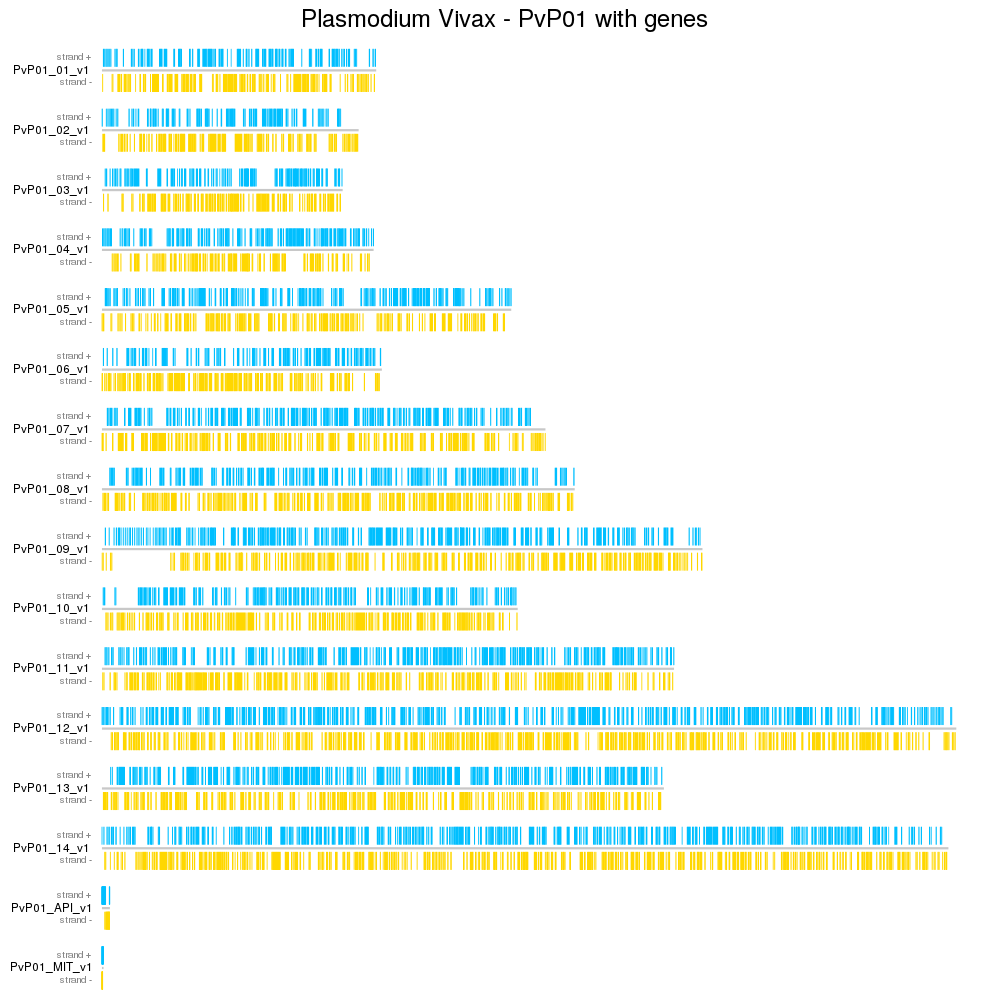
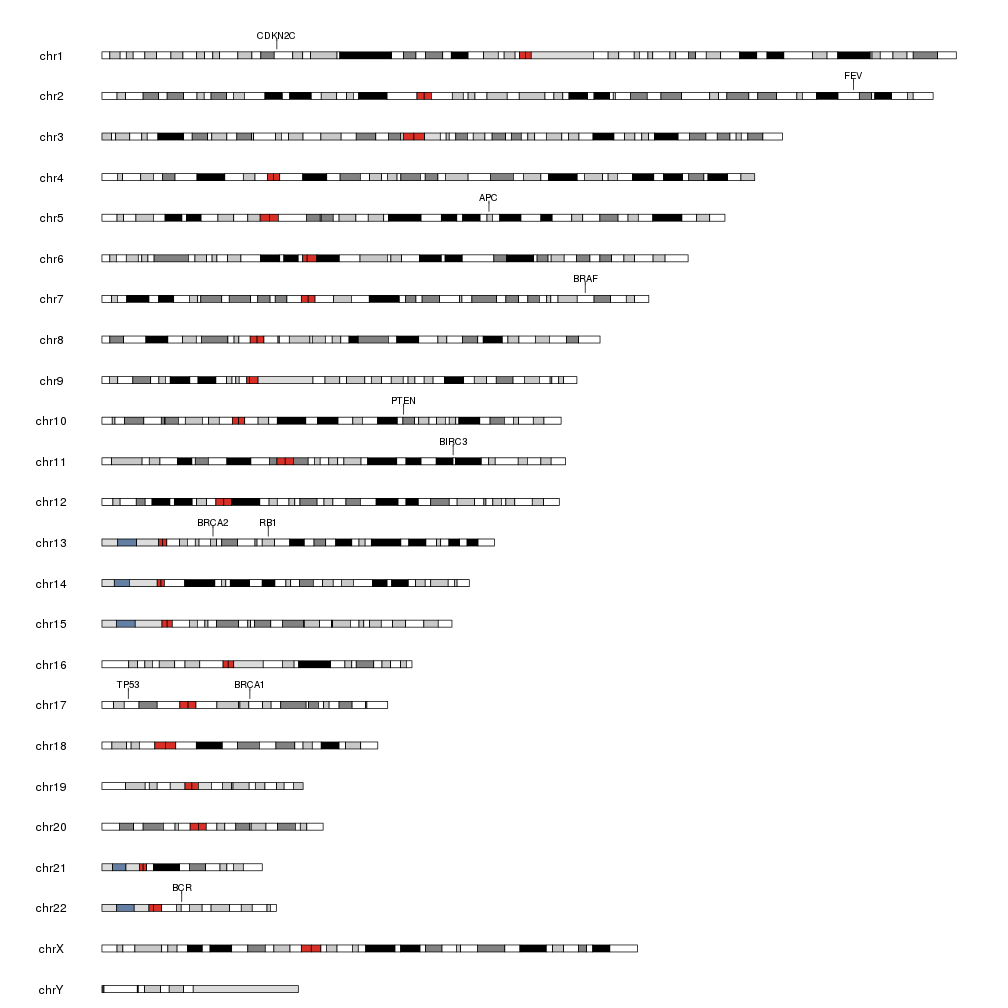
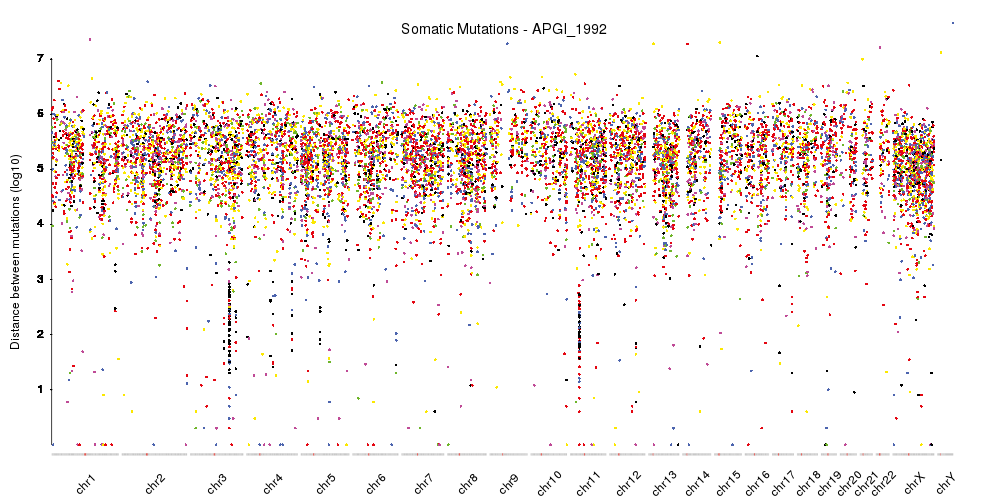
A few example plots created with karyoploteR
These images are all created with karyoploteR and are part of the documented
examples in the karyoploteR's tutorial and examples page.
Click on them to see how the code needed to create them.
bernatgel/karyoploteR documentation built on Feb. 1, 2024, 11:48 p.m.
R Package Documentation
Browse R Packages
We want your feedback!
Note that we can't provide technical support on individual packages. You should contact the package authors for that.
karyoploteR - An R/Biocondutor package to plot arbitrary data along the genome
Description
karyoploteR is an R package to plot data along the genome using a karyotype style plot.
It is entirely based on R base graphics and inspired by the R base graphics API. It includes functions to plot primitive graphic elements such as points, lines, rectangles, text, etc mapped into the genome plot coordinates and higher level functions to plot a heatmap, the regions in a GenomicRanges object or the cumulative coverage of such regions.
Data positioning and track configuration has been inspired by Circos and does not explicitly understands the concept of track. Thus, it is possible to freely specify where to plot the data and to create plots with multiple independent tracks or overlapping representations.
It is highly configurable and in addition to the parametrization of the different data plotting functions, it is possible to specify custom functions for every plotting action from the basic chromosome bands to the chromosome labels or base numbers as well as creating completely new plotting functions.
How to use it
Documentation (vignette and user manual) is available at the karyoploteR's Bioconductor landing page at http://bioconductor.org/packages/karyoploteR
Tutorial and Examples
In addition to the documentation above, a short tutorial and some examples can be found at https://bernatgel.github.io/karyoploter_tutorial/
Citing karyoploteR
karyoploteR has been developed by Bernat Gel and Eduard Serra at IGTP Hereditary Cancer Group.
If you use karyoploteR in your research, please cite the Bioinformatics paper describing it:
Bernat Gel & Eduard Serra. (2017). karyoploteR: an R/Bioconductor package to plot customizable genomes displaying arbitrary data. Bioinformatics, 31–33. doi:10.1093/bioinformatics/btx346
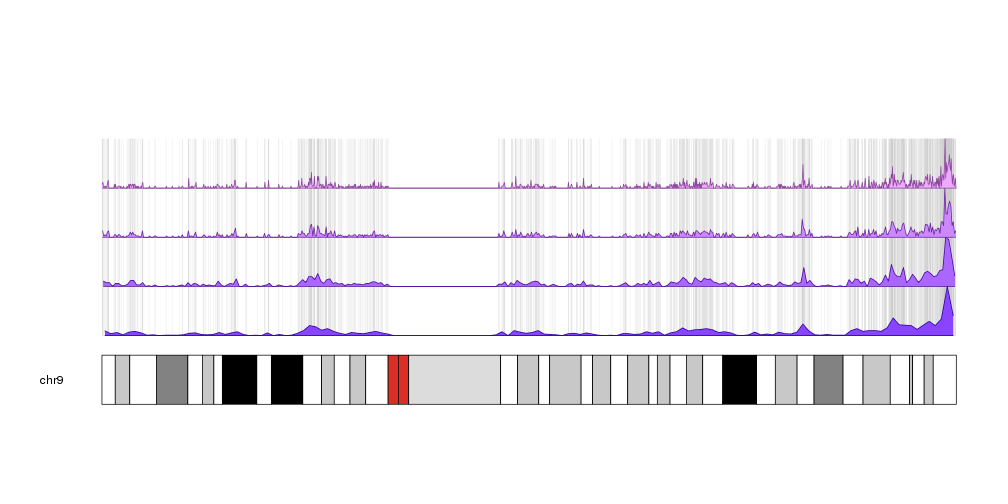
A few example plots created with karyoploteR
These images are all created with karyoploteR and are part of the documented examples in the karyoploteR's tutorial and examples page. Click on them to see how the code needed to create them.
R Package Documentation
Browse R Packages
We want your feedback!
Note that we can't provide technical support on individual packages. You should contact the package authors for that.
Embedding an R snippet on your website
Add the following code to your website.
For more information on customizing the embed code, read Embedding Snippets.