In hiplot/animalcules: Interactive microbiome analysis toolkit
knitr::opts_chunk$set(echo = TRUE)
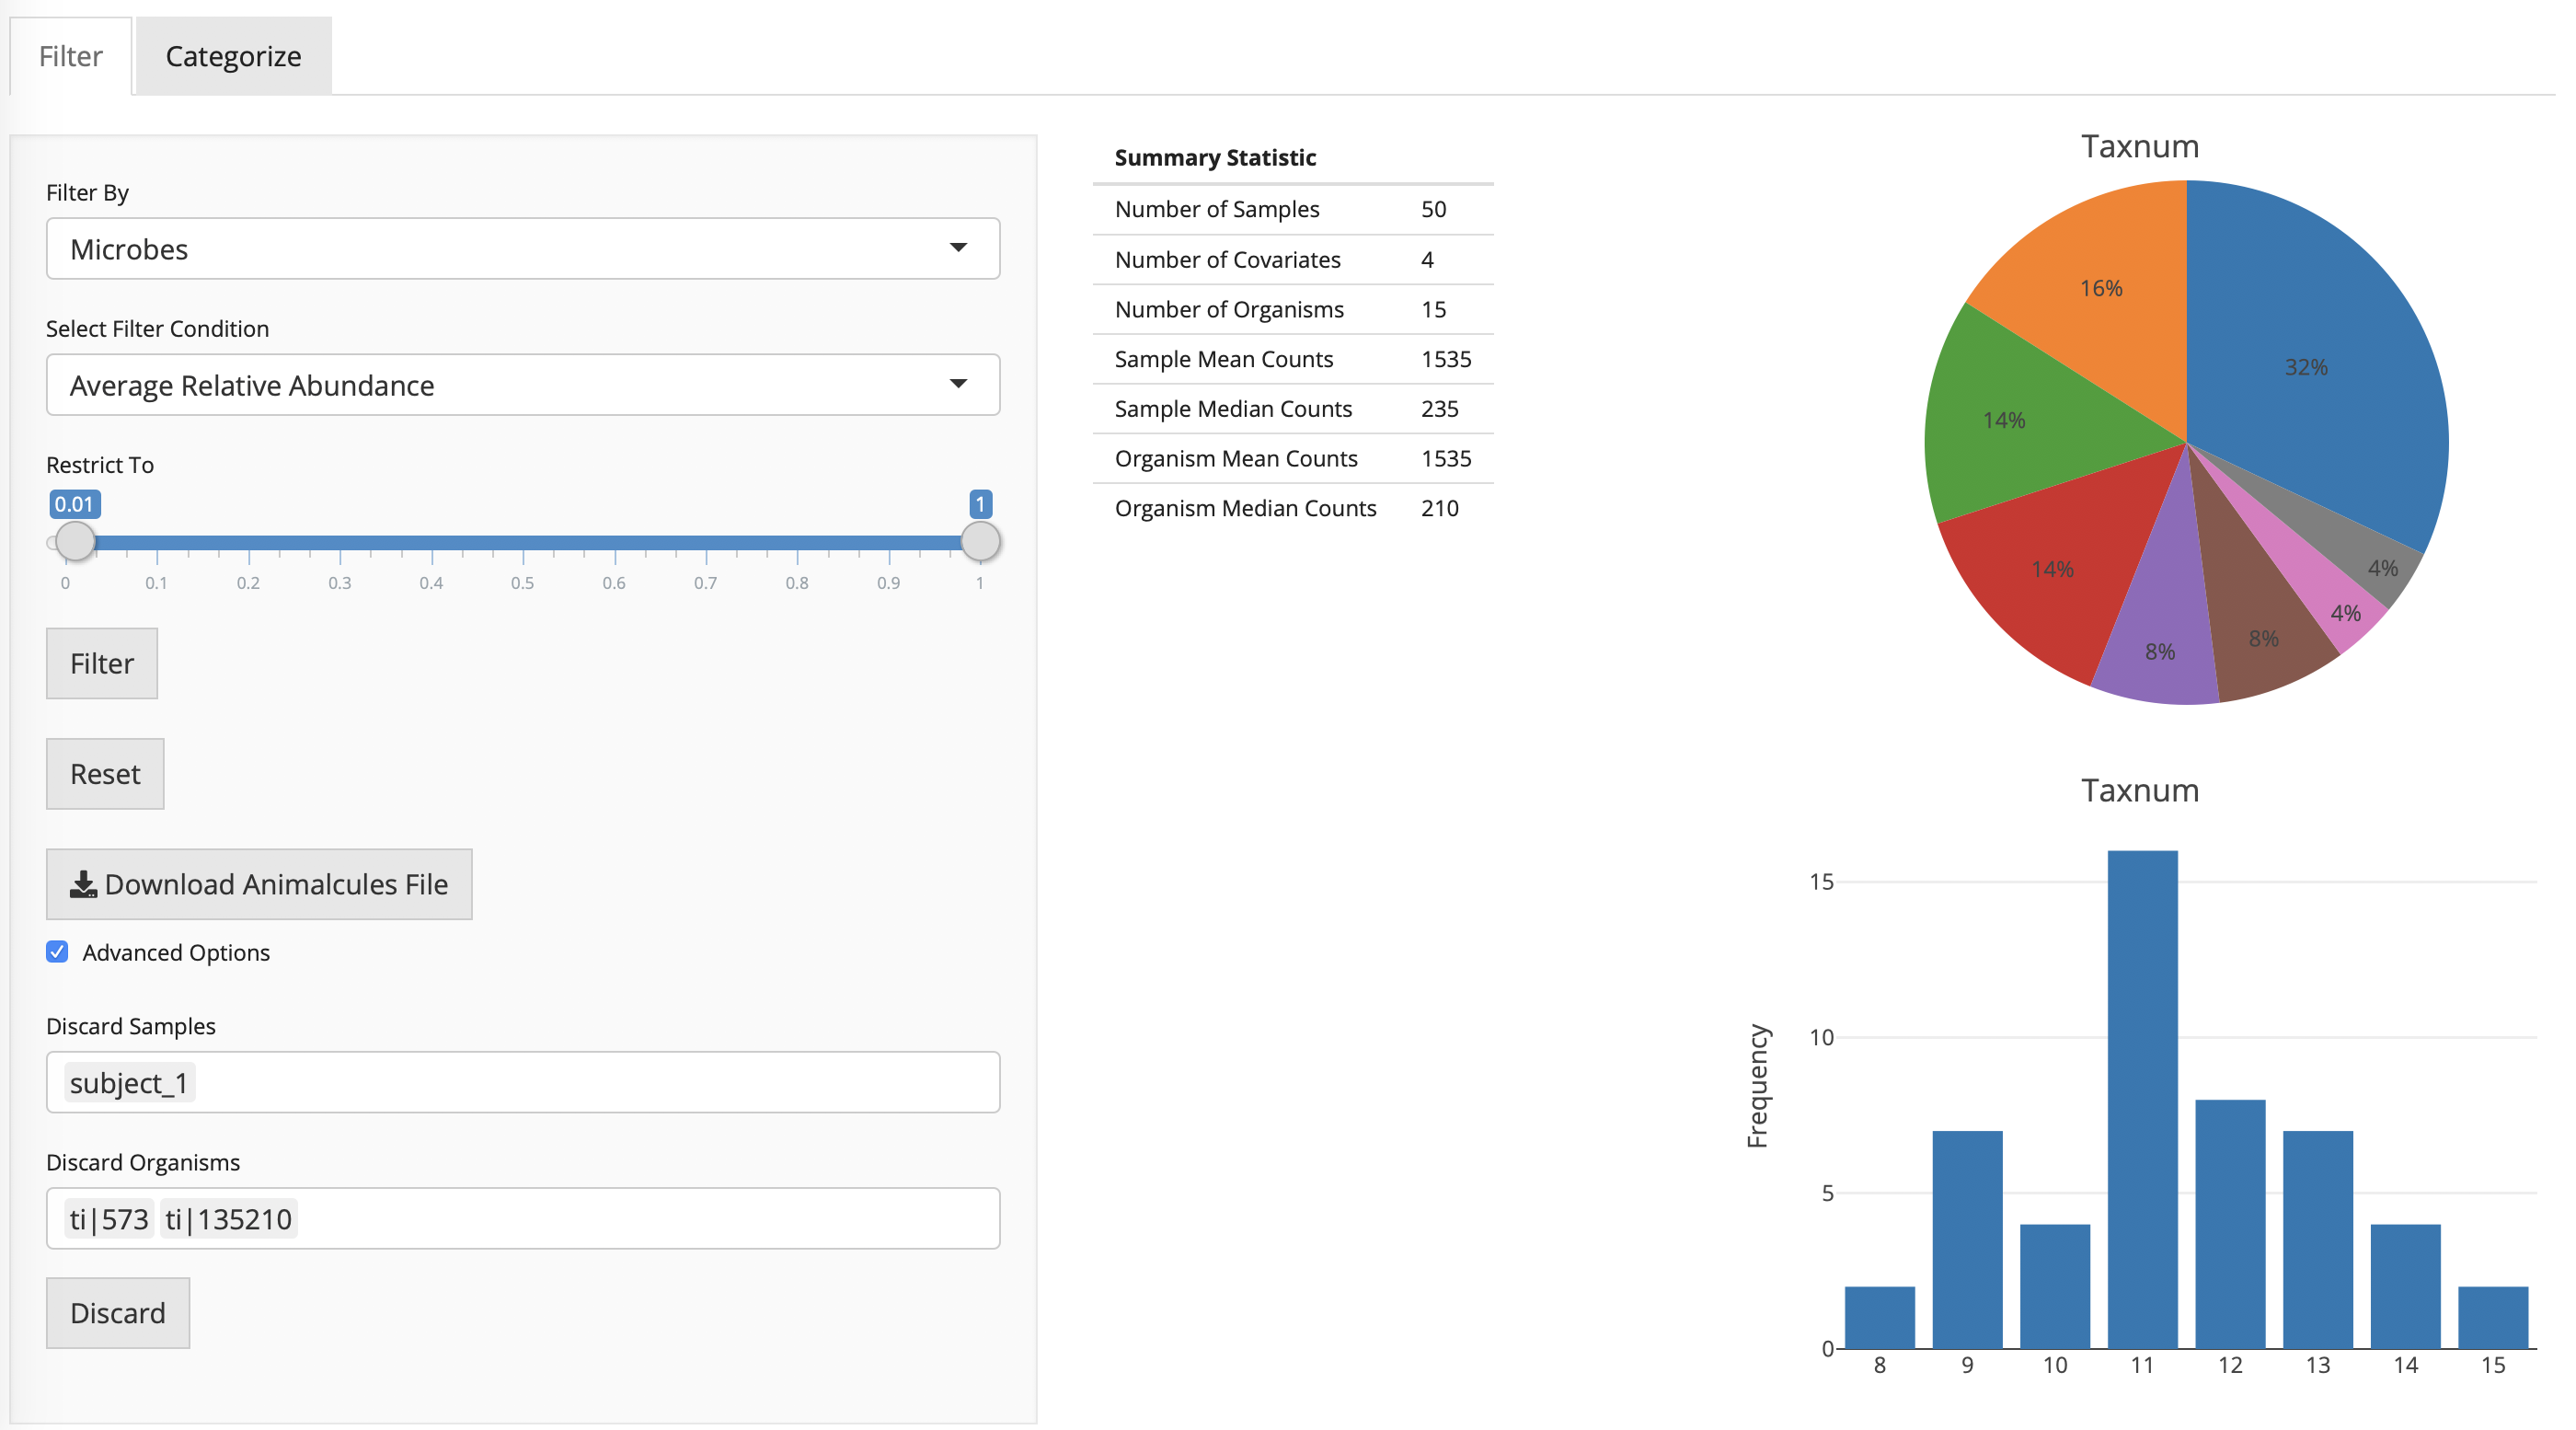
Summary Plots
One type of summarization plot returns either a box plot or pie chart for continous or categorical data respectively while another type returns returns either a density plot or bar plot for continous or categorical data respectively.
Instructions:
- Filter by either metadata or microbe information
- Select a condition to filter by
- Choose a cutoff point or range of acceptable values
- (Optional) Discard samples or organisms
- Click filter to filter the datasaet
- Click reset to remove all previous applied filters
- Click download to export the modified animacules file for later use
Running time: < 1s
Categorize
It is often necessary to bin continuous data into categories when performing analyses that require categorical input. To help ease this process, users can automatically categorize categorical data and provide custom bin breaks and labels in doing so.
Instructions:
- Select a continous variable to categorize
- (Optional) Choose the number of bins
- (Optional) Choose a new variable name
- (Optional) Set custom breaks to define the new bins
- (Optional) Add custom labels to each of the bins
- Click "Create Bins"
Running time: < 1s

hiplot/animalcules documentation built on March 1, 2021, 12:04 a.m.
R Package Documentation
Browse R Packages
We want your feedback!
Note that we can't provide technical support on individual packages. You should contact the package authors for that.
knitr::opts_chunk$set(echo = TRUE)
Summary Plots
One type of summarization plot returns either a box plot or pie chart for continous or categorical data respectively while another type returns returns either a density plot or bar plot for continous or categorical data respectively.
Instructions:
- Filter by either metadata or microbe information
- Select a condition to filter by
- Choose a cutoff point or range of acceptable values
- (Optional) Discard samples or organisms
- Click filter to filter the datasaet
- Click reset to remove all previous applied filters
- Click download to export the modified animacules file for later use
Running time: < 1s
Categorize
It is often necessary to bin continuous data into categories when performing analyses that require categorical input. To help ease this process, users can automatically categorize categorical data and provide custom bin breaks and labels in doing so.
Instructions:
- Select a continous variable to categorize
- (Optional) Choose the number of bins
- (Optional) Choose a new variable name
- (Optional) Set custom breaks to define the new bins
- (Optional) Add custom labels to each of the bins
- Click "Create Bins"
Running time: < 1s
R Package Documentation
Browse R Packages
We want your feedback!
Note that we can't provide technical support on individual packages. You should contact the package authors for that.
Embedding an R snippet on your website
Add the following code to your website.
For more information on customizing the embed code, read Embedding Snippets.