barPlotter: Display census in a barplot
In leeleavitt/procPharm: Constellation Pharmacology Data Analysis
Description
Usage
Arguments
Examples
View source: R/visualization.R
Description
Display census in a barplot
Usage
1
barPlotter(dat = NULL, cols = "Dark2", selectCT = T, horiz = T)
Arguments
dat
this can either be and experiment RD.experiment or a vector of file paths see example
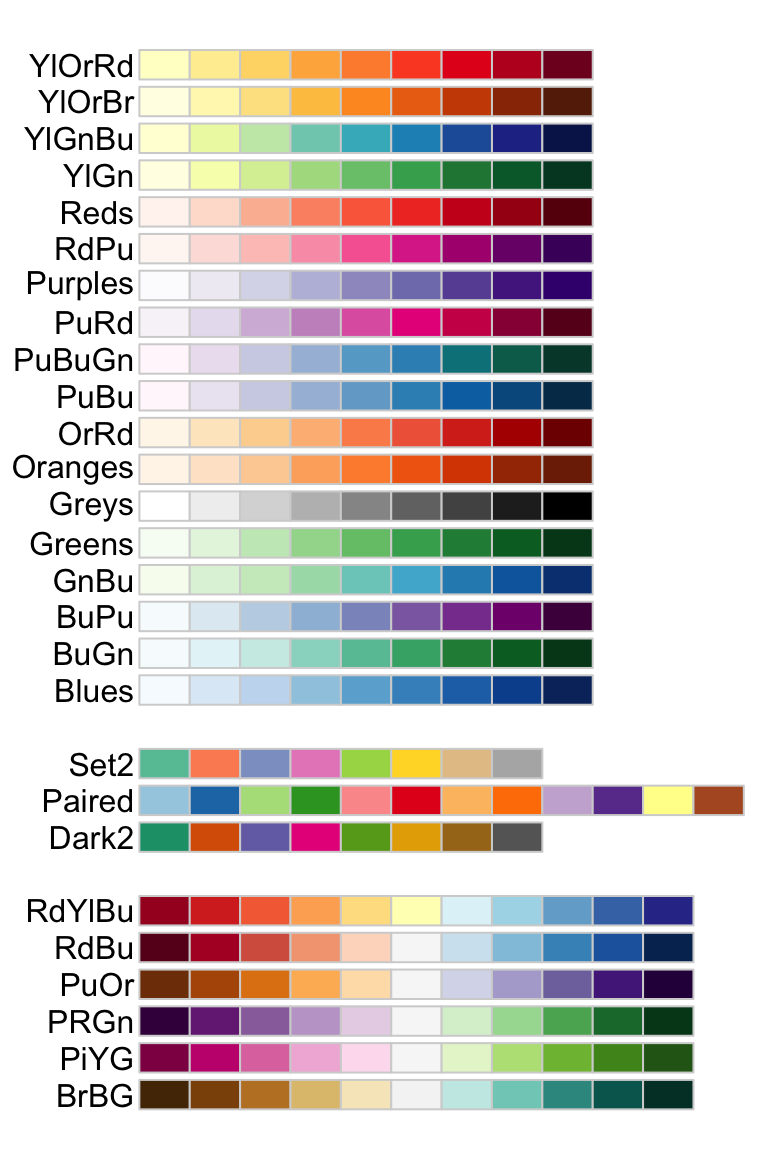
cols
this is the colo.brewer pallette to use. click here
selectCT
logical T or F for cleaning up cell types
horiz
logical T or F for how to plot the barplot
Examples
 1
 2
 3
 4
 5
 6
 7
 8
 9
10
11
12
13
14
15
16
17
18
19
20
21
22
23
24
25
26
27
## Not run:
# First step make single csv files from each experiment. Follow this general pattern
RD.experiment <- census_to_table(RD.experiment)
# Only select a single thing. For example only select amp
TableBrewer(RD.experiment)
#
#
# Once it is saved, open the cvs and manually rename the amp/first row something like "CNF EP1 1uM"
# additionally you have full control over the data in the cvs files. I warn against changing any numbers
# unless you are summing together other tables.
#
# Once it is saved, open the cvs and manually rename the amp something like "CNF EP1 1uM"
#
# Set the working directory to have the correct location. This will be where the files are located
# In the example you can see that i've set the working directory to
setwd('Y:/Cris Urcino/CNF experiments/Ep1/')
# This means i can access each csv file in the following way
tables <- c(
    "./190823.M.40.m3.p1 CNF-Ep1/amp.csv",
    "./200209.M.31.m3.p1 3uM.Ep1/amp.csv",
    "./200209.M.31.m3.p2 3uM.Ep1/amp.csv"
)
#
# Now barPlotter() it,
barPlotter(tables)

## End(Not run)
leeleavitt/procPharm documentation built on Feb. 3, 2021, 11:43 a.m.
R Package Documentation
Browse R Packages
We want your feedback!
Note that we can't provide technical support on individual packages. You should contact the package authors for that.
Description Usage Arguments Examples
View source: R/visualization.R
Description
Display census in a barplot
Usage
1 | barPlotter(dat = NULL, cols = "Dark2", selectCT = T, horiz = T)
|
Arguments
dat |
this can either be and experiment RD.experiment or a vector of file paths see example |
cols |
this is the colo.brewer pallette to use. click here |
selectCT |
logical T or F for cleaning up cell types |
horiz |
logical T or F for how to plot the barplot |
Examples
1 2 3 4 5 6 7 8 9 10 11 12 13 14 15 16 17 18 19 20 21 22 23 24 25 26 27 | ## Not run:
# First step make single csv files from each experiment. Follow this general pattern
RD.experiment <- census_to_table(RD.experiment)
# Only select a single thing. For example only select amp
TableBrewer(RD.experiment)
#
#
# Once it is saved, open the cvs and manually rename the amp/first row something like "CNF EP1 1uM"
# additionally you have full control over the data in the cvs files. I warn against changing any numbers
# unless you are summing together other tables.
#
# Once it is saved, open the cvs and manually rename the amp something like "CNF EP1 1uM"
#
# Set the working directory to have the correct location. This will be where the files are located
# In the example you can see that i've set the working directory to
setwd('Y:/Cris Urcino/CNF experiments/Ep1/')
# This means i can access each csv file in the following way
tables <- c(
"./190823.M.40.m3.p1 CNF-Ep1/amp.csv",
"./200209.M.31.m3.p1 3uM.Ep1/amp.csv",
"./200209.M.31.m3.p2 3uM.Ep1/amp.csv"
)
#
# Now barPlotter() it,
barPlotter(tables)
## End(Not run)
|
R Package Documentation
Browse R Packages
We want your feedback!
Note that we can't provide technical support on individual packages. You should contact the package authors for that.
Embedding an R snippet on your website
Add the following code to your website.
For more information on customizing the embed code, read Embedding Snippets.