opt_stylize: Stylize your table with a colorful look
In rstudio/gt: Easily Create Presentation-Ready Display Tables
opt_stylize R Documentation
Stylize your table with a colorful look
Description
With opt_stylize() you can quickly style your gt table with a carefully
curated set of background colors, line colors, and line styles. There are six
styles to choose from and they largely vary in the extent of coloring applied
to different table locations. Some have table borders applied, some apply
darker colors to the table stub and summary sections, and, some even have
vertical lines. In addition to choosing a style preset, there are six
color variations that each use a range of five color tints. Each of the
color tints have been fine-tuned to maximize the contrast between text and
its background. There are 36 combinations of style and color to choose
from.
Usage
opt_stylize(data, style = 1, color = "blue", add_row_striping = TRUE)
Arguments
data
The gt table data object
obj:<gt_tbl> // required
This is the gt table object that is commonly created through use of the
gt() function.
style
Table style
scalar<numeric|integer>(1>=val>=6) // default: 1
Six numbered styles are available. Simply provide a number from 1 (the
default) to 6 to choose a distinct look.
color
Color variation
scalar<character> // default: "blue"
There are six color variations: "blue", "cyan", "pink", "green",
"red", and "gray".
add_row_striping
Allow row striping
scalar<logical> // default: TRUE
An option to enable row striping in the table body for the style chosen.
Value
an object of class gt_tbl.
Examples
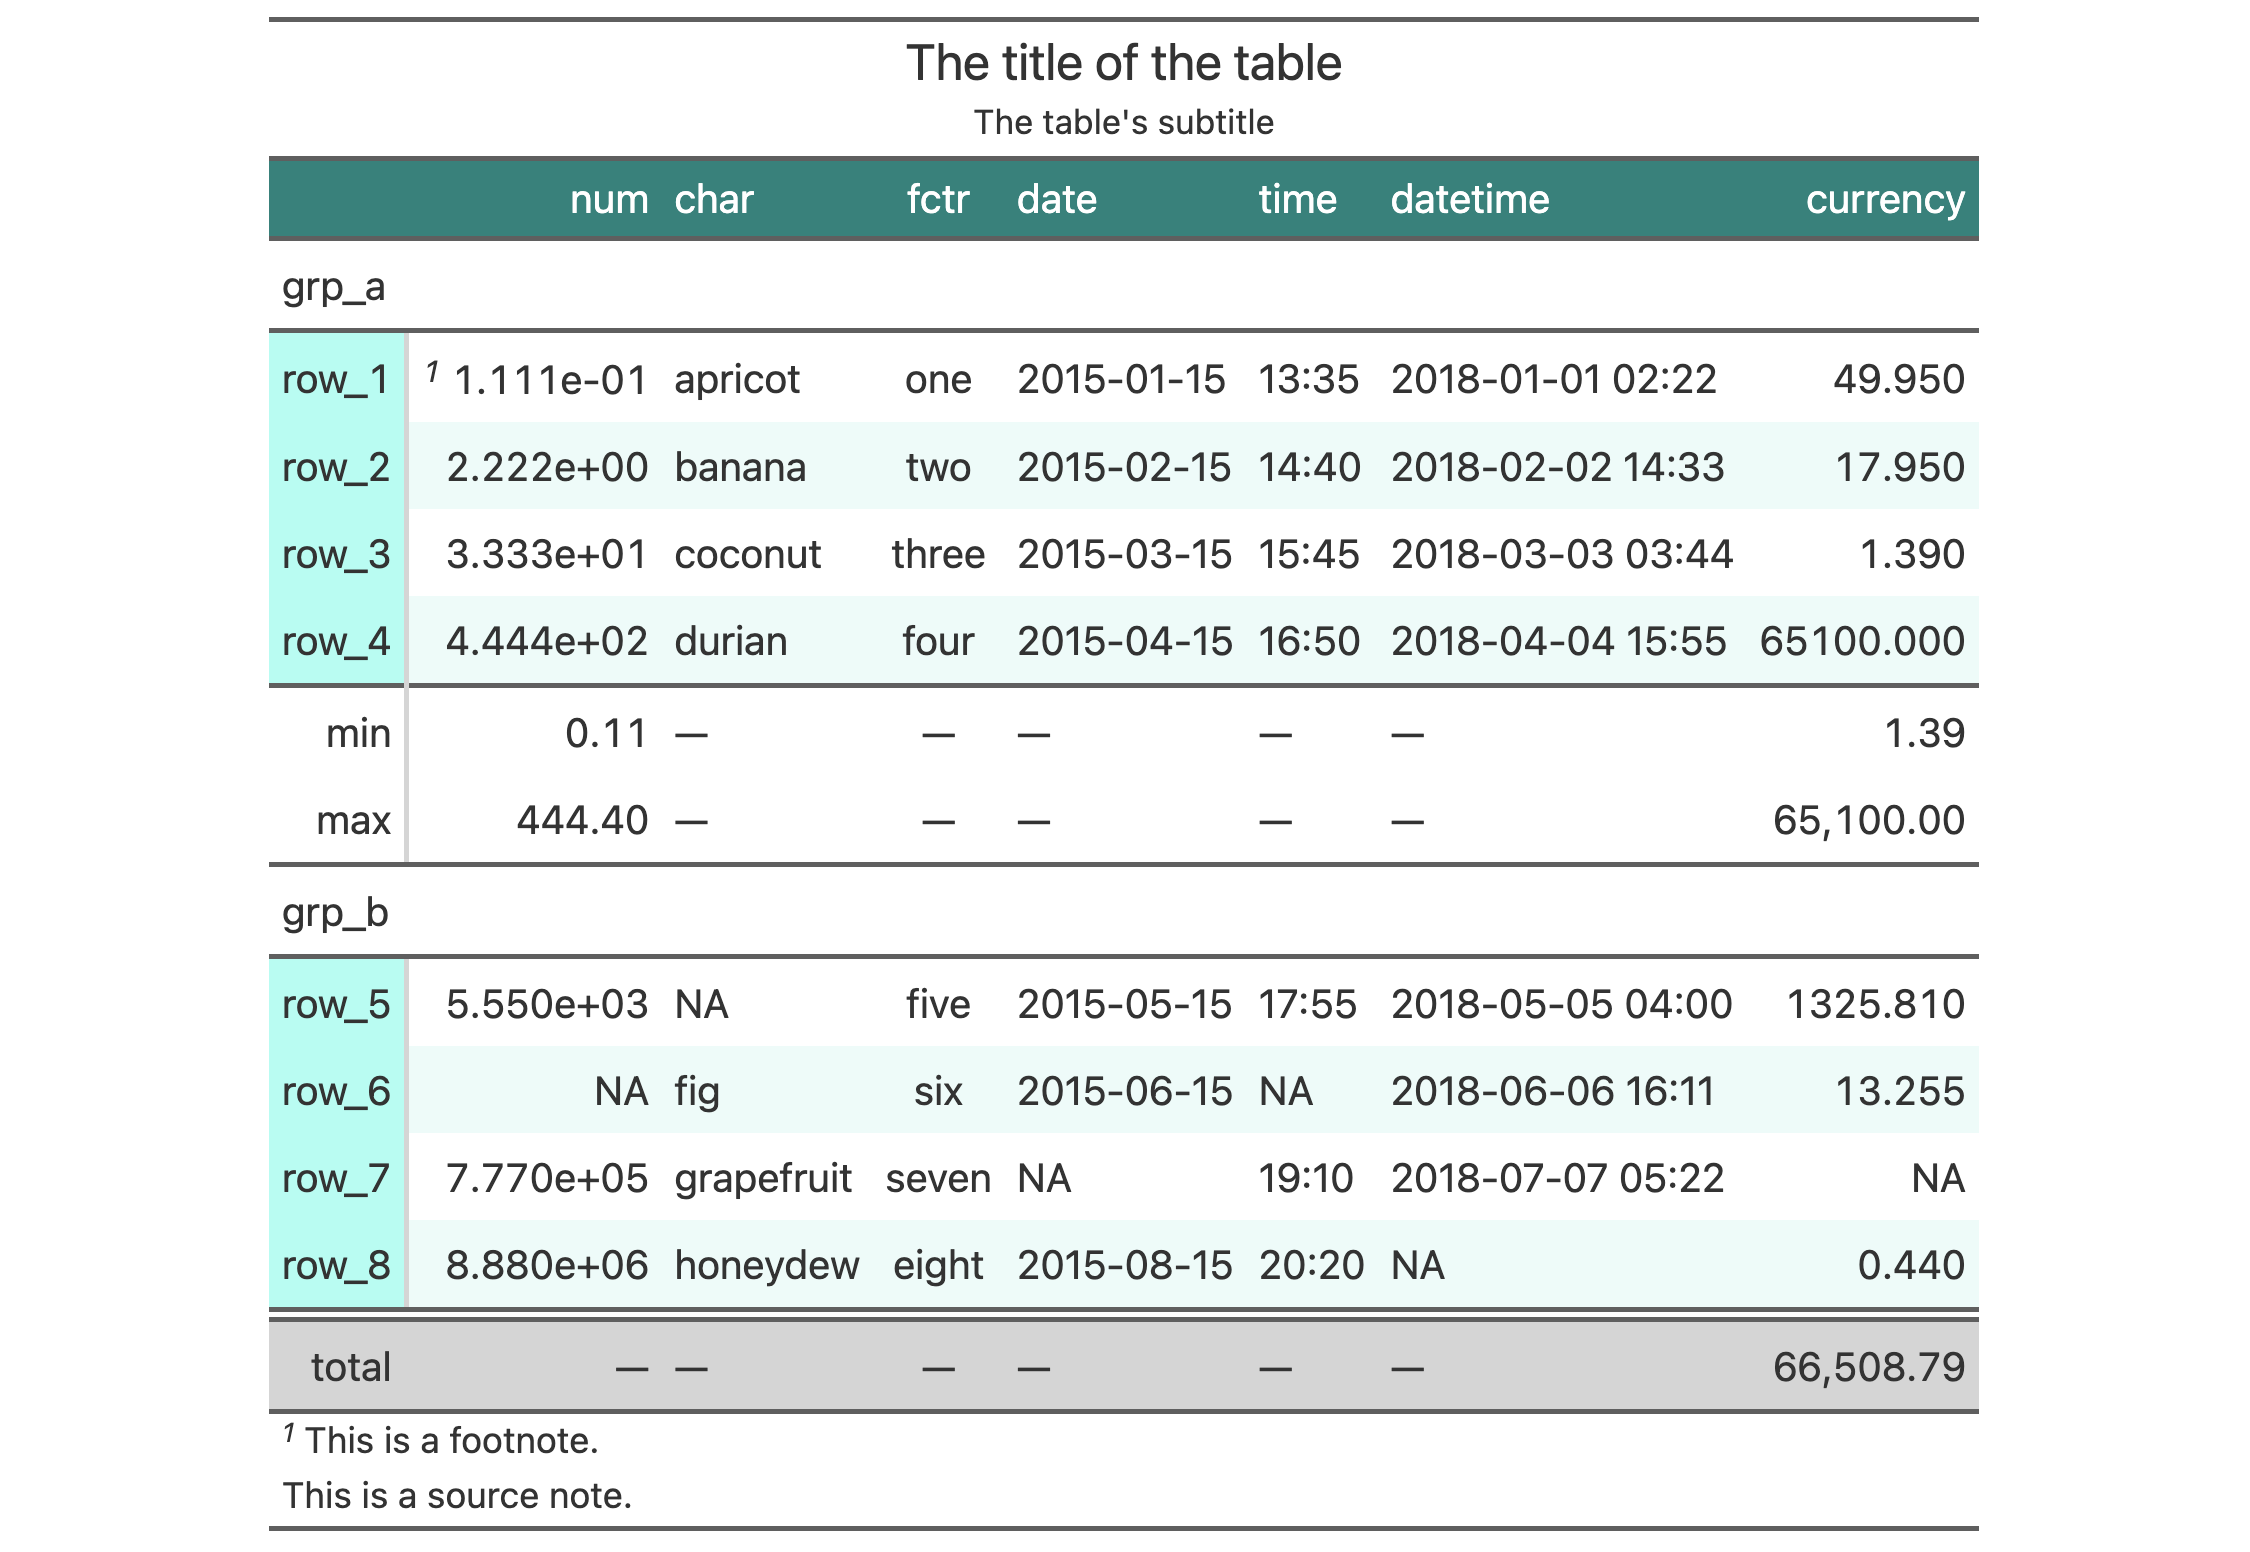
Use exibble to create a gt table with a number of table parts added.
Then, use opt_stylize() to give the table some additional style
(using the "cyan" color variation and style number 6).
exibble |>
  gt(rowname_col = "row", groupname_col = "group") |>
  summary_rows(
    groups = "grp_a",
    columns = c(num, currency),
    fns = c("min", "max")
  ) |>
  grand_summary_rows(
    columns = currency,
    fns = total ~ sum(., na.rm = TRUE)
  ) |>
  tab_source_note(source_note = "This is a source note.") |>
  tab_footnote(
    footnote = "This is a footnote.",
    locations = cells_body(columns = 1, rows = 1)
  ) |>
  tab_header(
    title = "The title of the table",
    subtitle = "The table's subtitle"
  ) |>
  opt_stylize(style = 6, color = "cyan")

Function ID
10-1
Function Introduced
v0.7.0 (Aug 25, 2022)
See Also
Other table option functions:
opt_align_table_header(),
opt_all_caps(),
opt_css(),
opt_footnote_marks(),
opt_footnote_spec(),
opt_horizontal_padding(),
opt_interactive(),
opt_row_striping(),
opt_table_font(),
opt_table_lines(),
opt_table_outline(),
opt_vertical_padding()
rstudio/gt documentation built on March 29, 2025, 4:02 a.m.
| opt_stylize | R Documentation |
Stylize your table with a colorful look
Description
With opt_stylize() you can quickly style your gt table with a carefully
curated set of background colors, line colors, and line styles. There are six
styles to choose from and they largely vary in the extent of coloring applied
to different table locations. Some have table borders applied, some apply
darker colors to the table stub and summary sections, and, some even have
vertical lines. In addition to choosing a style preset, there are six
color variations that each use a range of five color tints. Each of the
color tints have been fine-tuned to maximize the contrast between text and
its background. There are 36 combinations of style and color to choose
from.
Usage
opt_stylize(data, style = 1, color = "blue", add_row_striping = TRUE)
Arguments
data |
The gt table data object
This is the gt table object that is commonly created through use of the
|
style |
Table style
Six numbered styles are available. Simply provide a number from |
color |
Color variation
There are six color variations: |
add_row_striping |
Allow row striping
An option to enable row striping in the table body for the |
Value
an object of class gt_tbl.
Examples
Use exibble to create a gt table with a number of table parts added.
Then, use opt_stylize() to give the table some additional style
(using the "cyan" color variation and style number 6).
exibble |>
gt(rowname_col = "row", groupname_col = "group") |>
summary_rows(
groups = "grp_a",
columns = c(num, currency),
fns = c("min", "max")
) |>
grand_summary_rows(
columns = currency,
fns = total ~ sum(., na.rm = TRUE)
) |>
tab_source_note(source_note = "This is a source note.") |>
tab_footnote(
footnote = "This is a footnote.",
locations = cells_body(columns = 1, rows = 1)
) |>
tab_header(
title = "The title of the table",
subtitle = "The table's subtitle"
) |>
opt_stylize(style = 6, color = "cyan")

Function ID
10-1
Function Introduced
v0.7.0 (Aug 25, 2022)
See Also
Other table option functions:
opt_align_table_header(),
opt_all_caps(),
opt_css(),
opt_footnote_marks(),
opt_footnote_spec(),
opt_horizontal_padding(),
opt_interactive(),
opt_row_striping(),
opt_table_font(),
opt_table_lines(),
opt_table_outline(),
opt_vertical_padding()
Add the following code to your website.
For more information on customizing the embed code, read Embedding Snippets.
