extract_summary: Extract a summary list from a *gt* object
In gt: Easily Create Presentation-Ready Display Tables
extract_summary R Documentation
Extract a summary list from a gt object
Description
Get a list of summary row data frames from a gt_tbl object where summary
rows were added via summary_rows(). The output data frames contain the
group_id and rowname columns, whereby rowname contains descriptive stub
labels for the summary rows.
Usage
extract_summary(data)
Arguments
data
The gt table data object
obj:<gt_tbl> // required
This is the gt table object that is commonly created through use of the
gt() function.
Value
A list of data frames containing summary data.
Examples
Use a modified version of sp500 the dataset to create a gt table with
row groups and row labels. Create summary rows labeled as min, max, and
avg for every row group with summary_rows(). Then, extract the summary
rows as a list object.
summary_extracted <-
  sp500 |>
  dplyr::filter(date >= "2015-01-05" & date <="2015-01-30") |>
  dplyr::arrange(date) |>
  dplyr::mutate(week = paste0("W", strftime(date, format = "%V"))) |>
  dplyr::select(-adj_close, -volume) |>
  gt(
    rowname_col = "date",
    groupname_col = "week"
  ) |>
  summary_rows(
    groups = everything(),
    columns = c(open, high, low, close),
    fns = list(
      min = ~min(.),
      max = ~max(.),
      avg = ~mean(.)
    ),
  ) |>
  extract_summary()

summary_extracted
#> $summary_df_data_list
#> $summary_df_data_list$W02
#> # A tibble: 3 x 9
#>   group_id row_id rowname  date  open  high   low close  week
#>   <chr>    <chr>  <chr>   <dbl> <dbl> <dbl> <dbl> <dbl> <dbl>
#> 1 W02      min    min        NA 2006. 2030. 1992. 2003.    NA
#> 2 W02      max    max        NA 2063. 2064. 2038. 2062.    NA
#> 3 W02      avg    avg        NA 2035. 2049. 2017. 2031.    NA
#>
#> $summary_df_data_list$W03
#> # A tibble: 3 x 9
#>   group_id row_id rowname  date  open  high   low close  week
#>   <chr>    <chr>  <chr>   <dbl> <dbl> <dbl> <dbl> <dbl> <dbl>
#> 1 W03      min    min        NA 1992. 2018. 1988. 1993.    NA
#> 2 W03      max    max        NA 2046. 2057. 2023. 2028.    NA
#> 3 W03      avg    avg        NA 2020. 2033. 2000. 2015.    NA
#>
#> $summary_df_data_list$W04
#> # A tibble: 3 x 9
#>   group_id row_id rowname  date  open  high   low close  week
#>   <chr>    <chr>  <chr>   <dbl> <dbl> <dbl> <dbl> <dbl> <dbl>
#> 1 W04      min    min        NA 2020. 2029. 2004. 2023.    NA
#> 2 W04      max    max        NA 2063. 2065. 2051. 2063.    NA
#> 3 W04      avg    avg        NA 2035. 2049. 2023. 2042.    NA
#>
#> $summary_df_data_list$W05
#> # A tibble: 3 x 9
#>   group_id row_id rowname  date  open  high   low close  week
#>   <chr>    <chr>  <chr>   <dbl> <dbl> <dbl> <dbl> <dbl> <dbl>
#> 1 W05      min    min        NA 2002. 2023. 1989. 1995.    NA
#> 2 W05      max    max        NA 2050. 2058. 2041. 2057.    NA
#> 3 W05      avg    avg        NA 2030. 2039. 2009. 2021.    NA
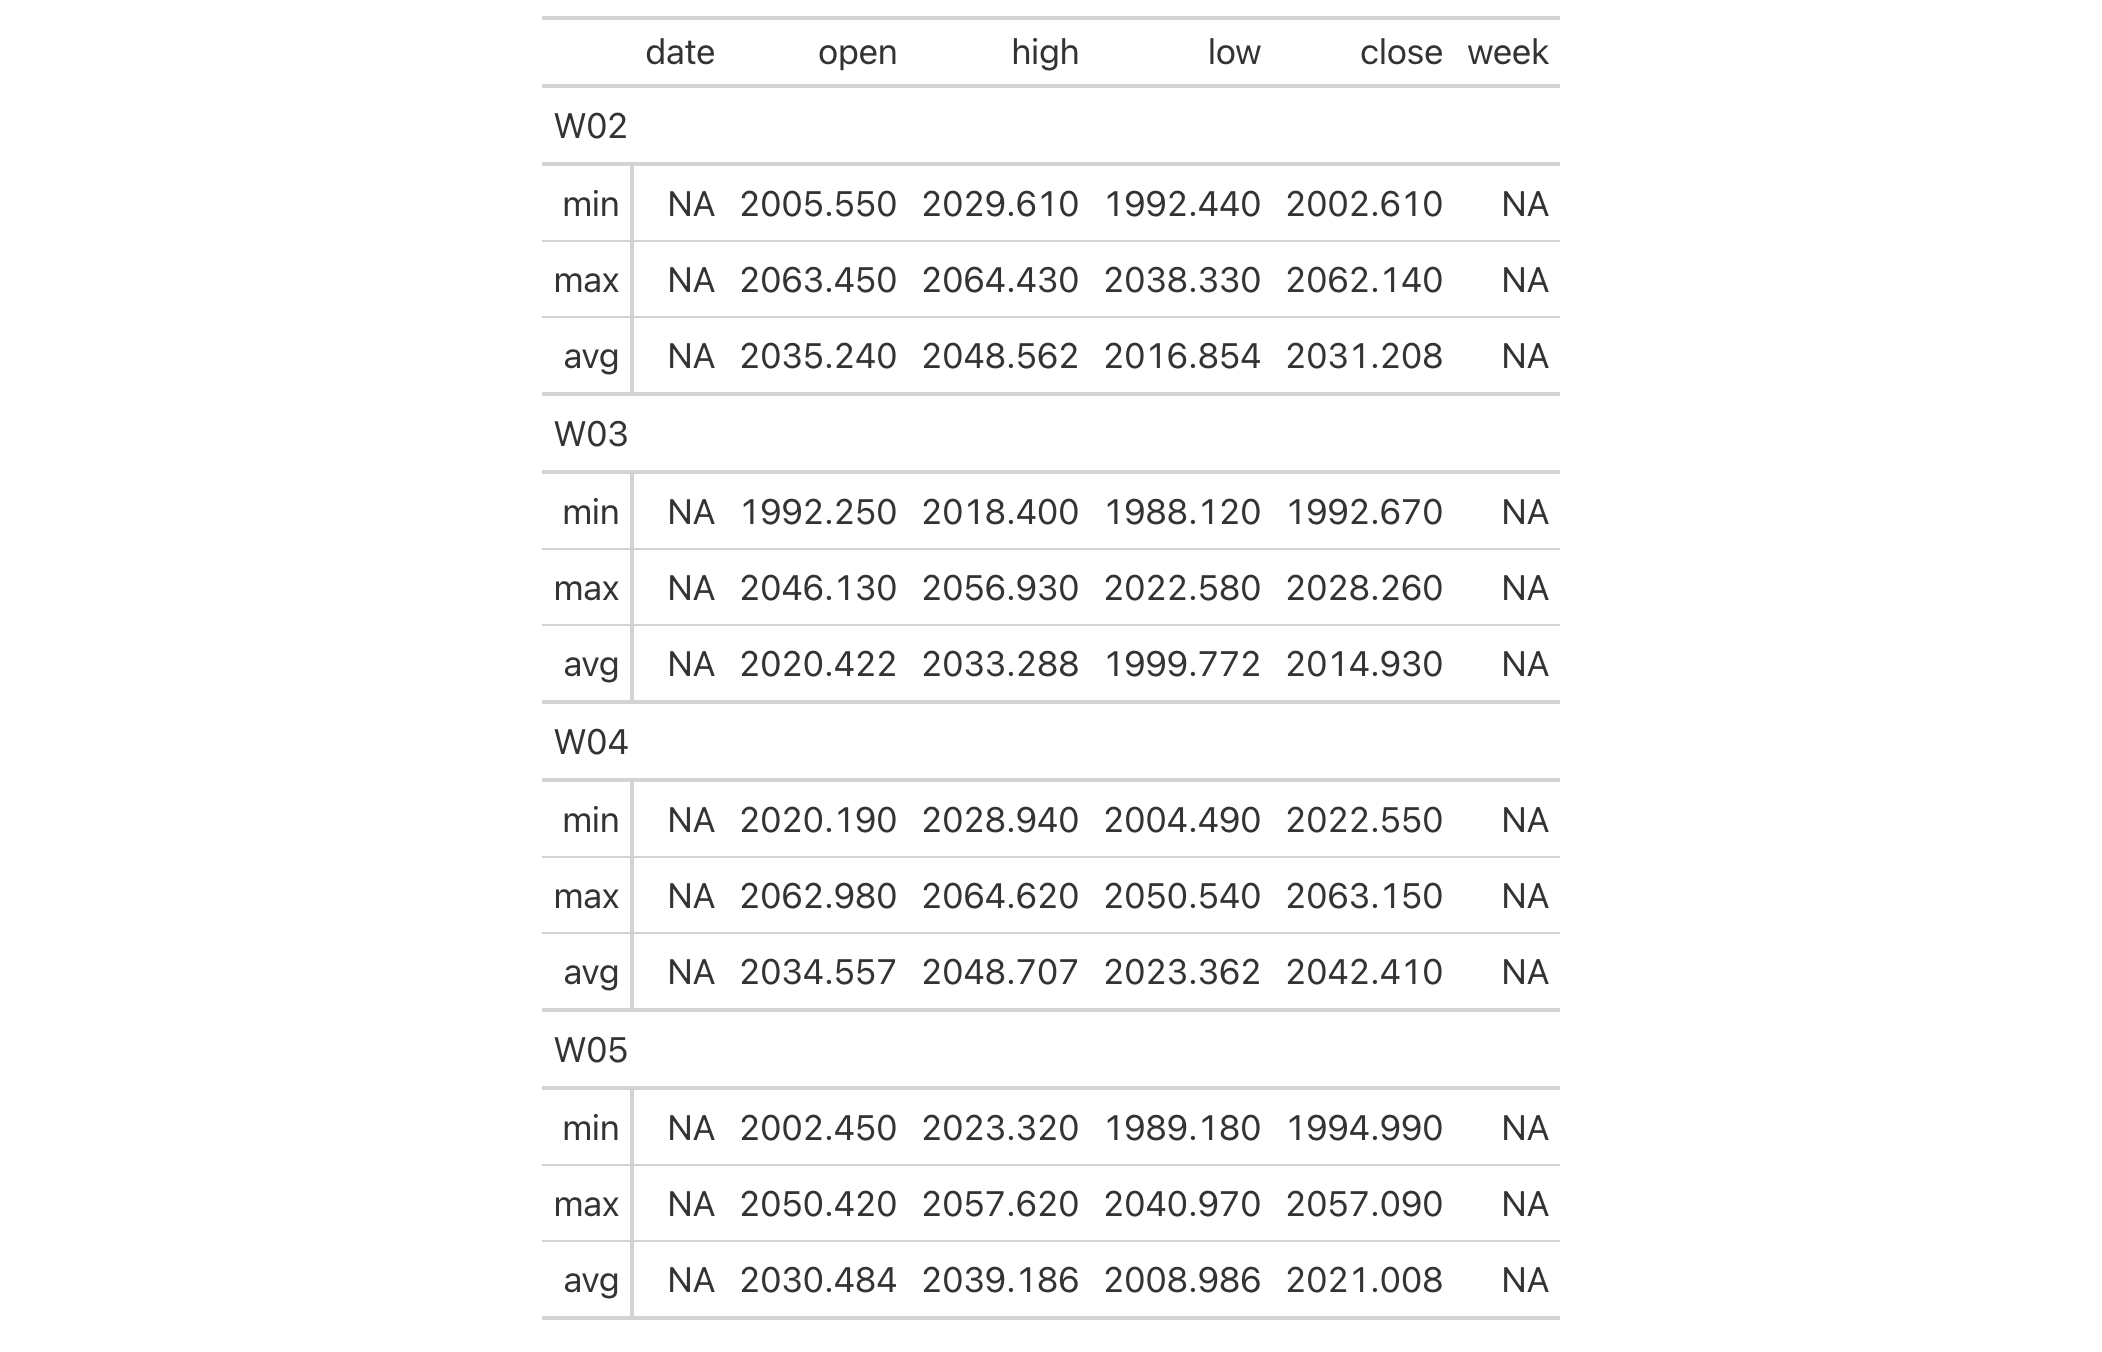
Use the summary list to make a new gt table. The key thing is to use
dplyr::bind_rows() and then pass the tibble to gt().
summary_extracted |>
  unlist(recursive = FALSE) |>
  dplyr::bind_rows() |>
  gt(groupname_col = "group_id") |>
  cols_hide(columns = row_id)
Function ID
13-8
Function Introduced
v0.2.0.5 (March 31, 2020)
See Also
Other table export functions:
as_gtable(),
as_latex(),
as_raw_html(),
as_rtf(),
as_word(),
extract_body(),
extract_cells(),
gtsave()
gt documentation built on Jan. 22, 2026, 9:07 a.m.
R Package Documentation
Browse R Packages
We want your feedback!
Note that we can't provide technical support on individual packages. You should contact the package authors for that.
| extract_summary | R Documentation |
Extract a summary list from a gt object
Description
Get a list of summary row data frames from a gt_tbl object where summary
rows were added via summary_rows(). The output data frames contain the
group_id and rowname columns, whereby rowname contains descriptive stub
labels for the summary rows.
Usage
extract_summary(data)
Arguments
data |
The gt table data object
This is the gt table object that is commonly created through use of the
|
Value
A list of data frames containing summary data.
Examples
Use a modified version of sp500 the dataset to create a gt table with
row groups and row labels. Create summary rows labeled as min, max, and
avg for every row group with summary_rows(). Then, extract the summary
rows as a list object.
summary_extracted <-
sp500 |>
dplyr::filter(date >= "2015-01-05" & date <="2015-01-30") |>
dplyr::arrange(date) |>
dplyr::mutate(week = paste0("W", strftime(date, format = "%V"))) |>
dplyr::select(-adj_close, -volume) |>
gt(
rowname_col = "date",
groupname_col = "week"
) |>
summary_rows(
groups = everything(),
columns = c(open, high, low, close),
fns = list(
min = ~min(.),
max = ~max(.),
avg = ~mean(.)
),
) |>
extract_summary()
summary_extracted
#> $summary_df_data_list
#> $summary_df_data_list$W02
#> # A tibble: 3 x 9
#> group_id row_id rowname date open high low close week
#> <chr> <chr> <chr> <dbl> <dbl> <dbl> <dbl> <dbl> <dbl>
#> 1 W02 min min NA 2006. 2030. 1992. 2003. NA
#> 2 W02 max max NA 2063. 2064. 2038. 2062. NA
#> 3 W02 avg avg NA 2035. 2049. 2017. 2031. NA
#>
#> $summary_df_data_list$W03
#> # A tibble: 3 x 9
#> group_id row_id rowname date open high low close week
#> <chr> <chr> <chr> <dbl> <dbl> <dbl> <dbl> <dbl> <dbl>
#> 1 W03 min min NA 1992. 2018. 1988. 1993. NA
#> 2 W03 max max NA 2046. 2057. 2023. 2028. NA
#> 3 W03 avg avg NA 2020. 2033. 2000. 2015. NA
#>
#> $summary_df_data_list$W04
#> # A tibble: 3 x 9
#> group_id row_id rowname date open high low close week
#> <chr> <chr> <chr> <dbl> <dbl> <dbl> <dbl> <dbl> <dbl>
#> 1 W04 min min NA 2020. 2029. 2004. 2023. NA
#> 2 W04 max max NA 2063. 2065. 2051. 2063. NA
#> 3 W04 avg avg NA 2035. 2049. 2023. 2042. NA
#>
#> $summary_df_data_list$W05
#> # A tibble: 3 x 9
#> group_id row_id rowname date open high low close week
#> <chr> <chr> <chr> <dbl> <dbl> <dbl> <dbl> <dbl> <dbl>
#> 1 W05 min min NA 2002. 2023. 1989. 1995. NA
#> 2 W05 max max NA 2050. 2058. 2041. 2057. NA
#> 3 W05 avg avg NA 2030. 2039. 2009. 2021. NA
Use the summary list to make a new gt table. The key thing is to use
dplyr::bind_rows() and then pass the tibble to gt().
summary_extracted |> unlist(recursive = FALSE) |> dplyr::bind_rows() |> gt(groupname_col = "group_id") |> cols_hide(columns = row_id)
Function ID
13-8
Function Introduced
v0.2.0.5 (March 31, 2020)
See Also
Other table export functions:
as_gtable(),
as_latex(),
as_raw_html(),
as_rtf(),
as_word(),
extract_body(),
extract_cells(),
gtsave()
R Package Documentation
Browse R Packages
We want your feedback!
Note that we can't provide technical support on individual packages. You should contact the package authors for that.
Embedding an R snippet on your website
Add the following code to your website.
For more information on customizing the embed code, read Embedding Snippets.