row_order: Modify the order of rows within groups
In gt: Easily Create Presentation-Ready Display Tables
row_order R Documentation
Modify the order of rows within groups
Description
We can modify the display order of rows within any row groups in a gt
object with row_order(). One or more column names can be provided to define
the sorting criteria. By default, rows are sorted in ascending order; use
reverse = TRUE to sort in descending order. The ordering is applied lazily
during the table build phase, ensuring it works alongside other row-reordering
operations.
Usage
row_order(data, ..., groups = NULL, reverse = FALSE)
Arguments
data
The gt table data object
obj:<gt_tbl> // required
This is the gt table object that is commonly created through use of the
gt() function.
...
Column expressions for ordering
<column expressions> // required
Column names or expressions describing how to order the rows. Multiple
columns can be specified for hierarchical sorting, where the first column
is the primary sort key.
groups
Specification of row group IDs
vector<character>|NULL // default: NULL
An optional character vector of row group ID values to target. If NULL
(the default), the ordering is applied to rows in all groups. If specified,
only rows within the indicated groups will be reordered.
reverse
Reverse the sort order
scalar<logical> // default: FALSE
Should the sort order be reversed (i.e., descending)? By default this is
FALSE, which sorts in ascending order.
Value
An object of class gt_tbl.
Examples
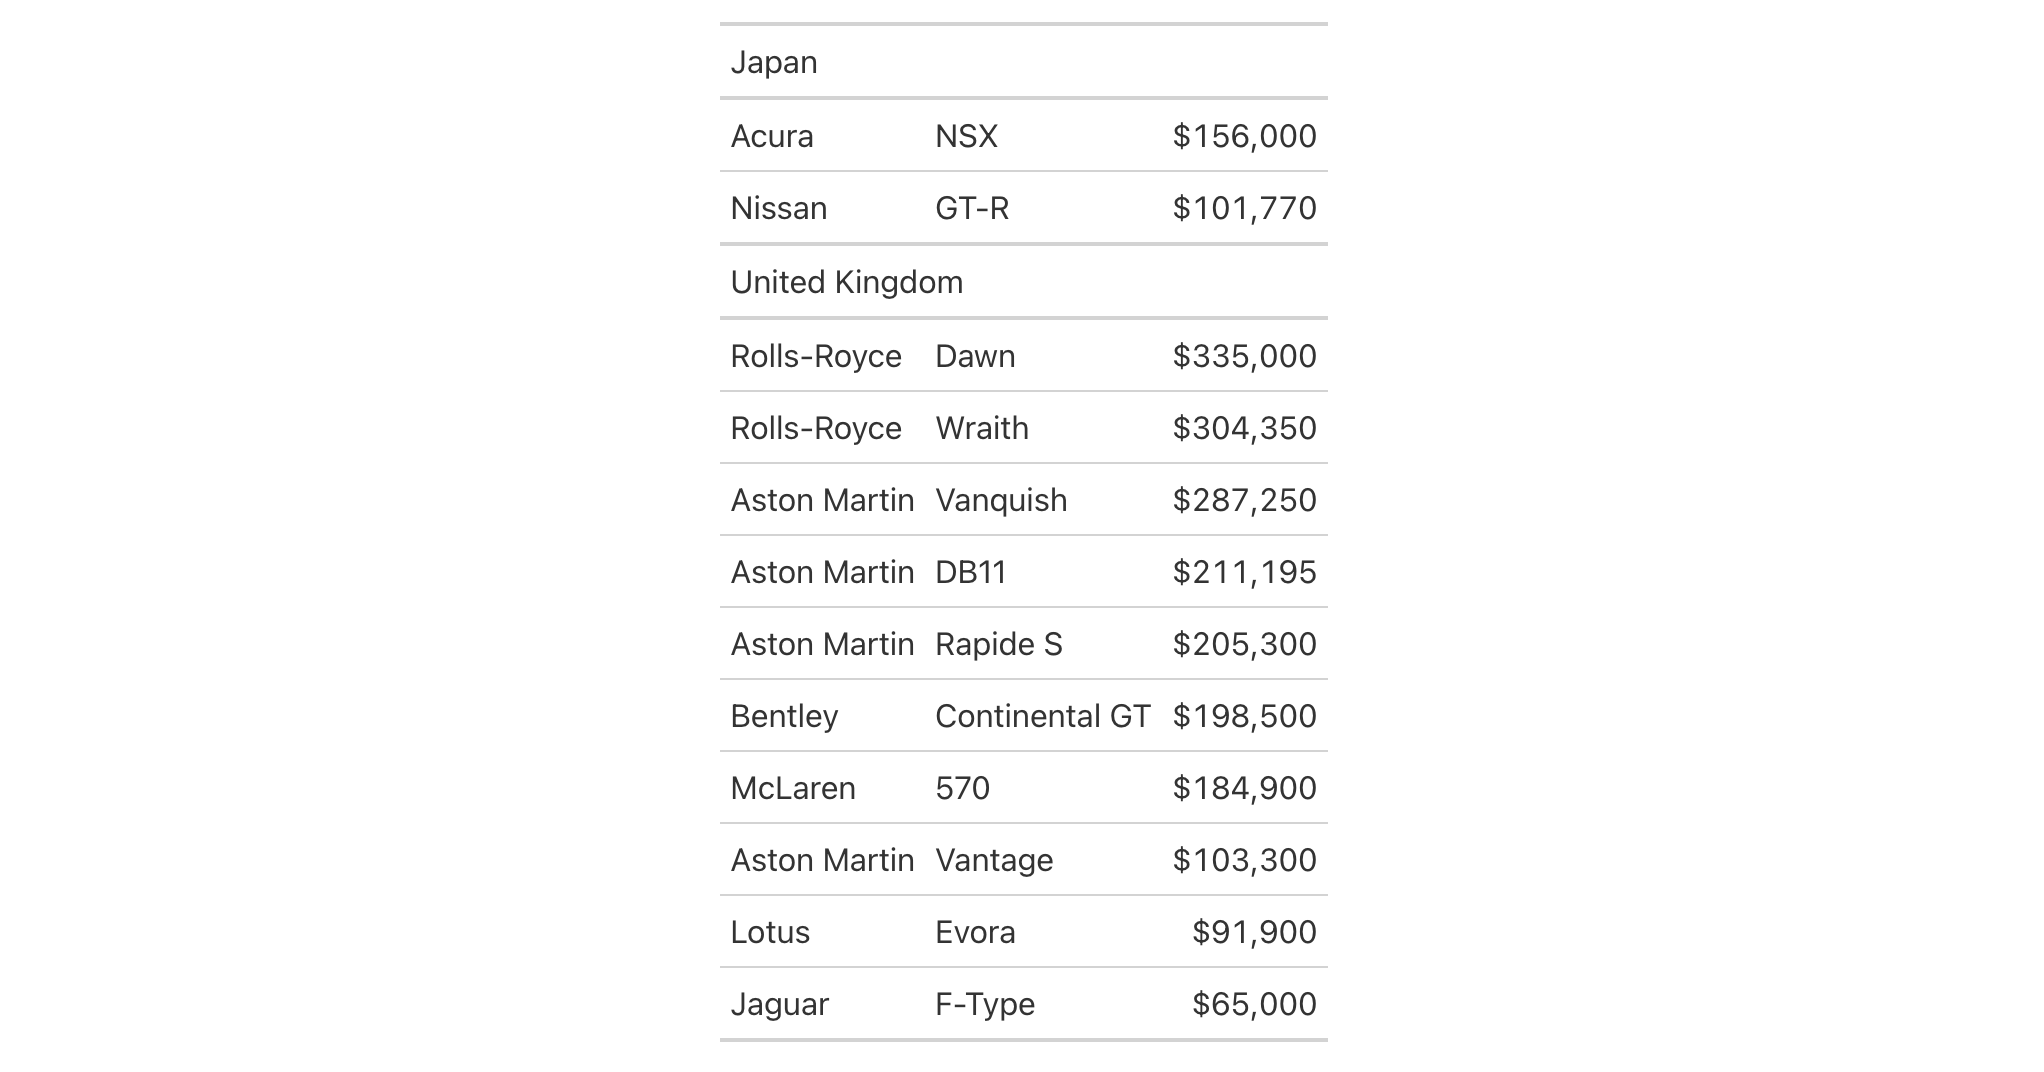
Let's use the gtcars dataset to demonstrate row ordering within groups.
We'll create a gt table grouped by country and then order rows within
each group by the car price in descending order.
gtcars |>
  dplyr::select(mfr, model, ctry_origin, msrp) |>
  dplyr::filter(ctry_origin %in% c("Japan", "United Kingdom")) |>
  dplyr::slice_head(n = 12) |>
  gt(groupname_col = "ctry_origin") |>
  row_order(msrp, reverse = TRUE) |>
  fmt_currency(columns = msrp, decimals = 0) |>
  tab_options(column_labels.hidden = TRUE)
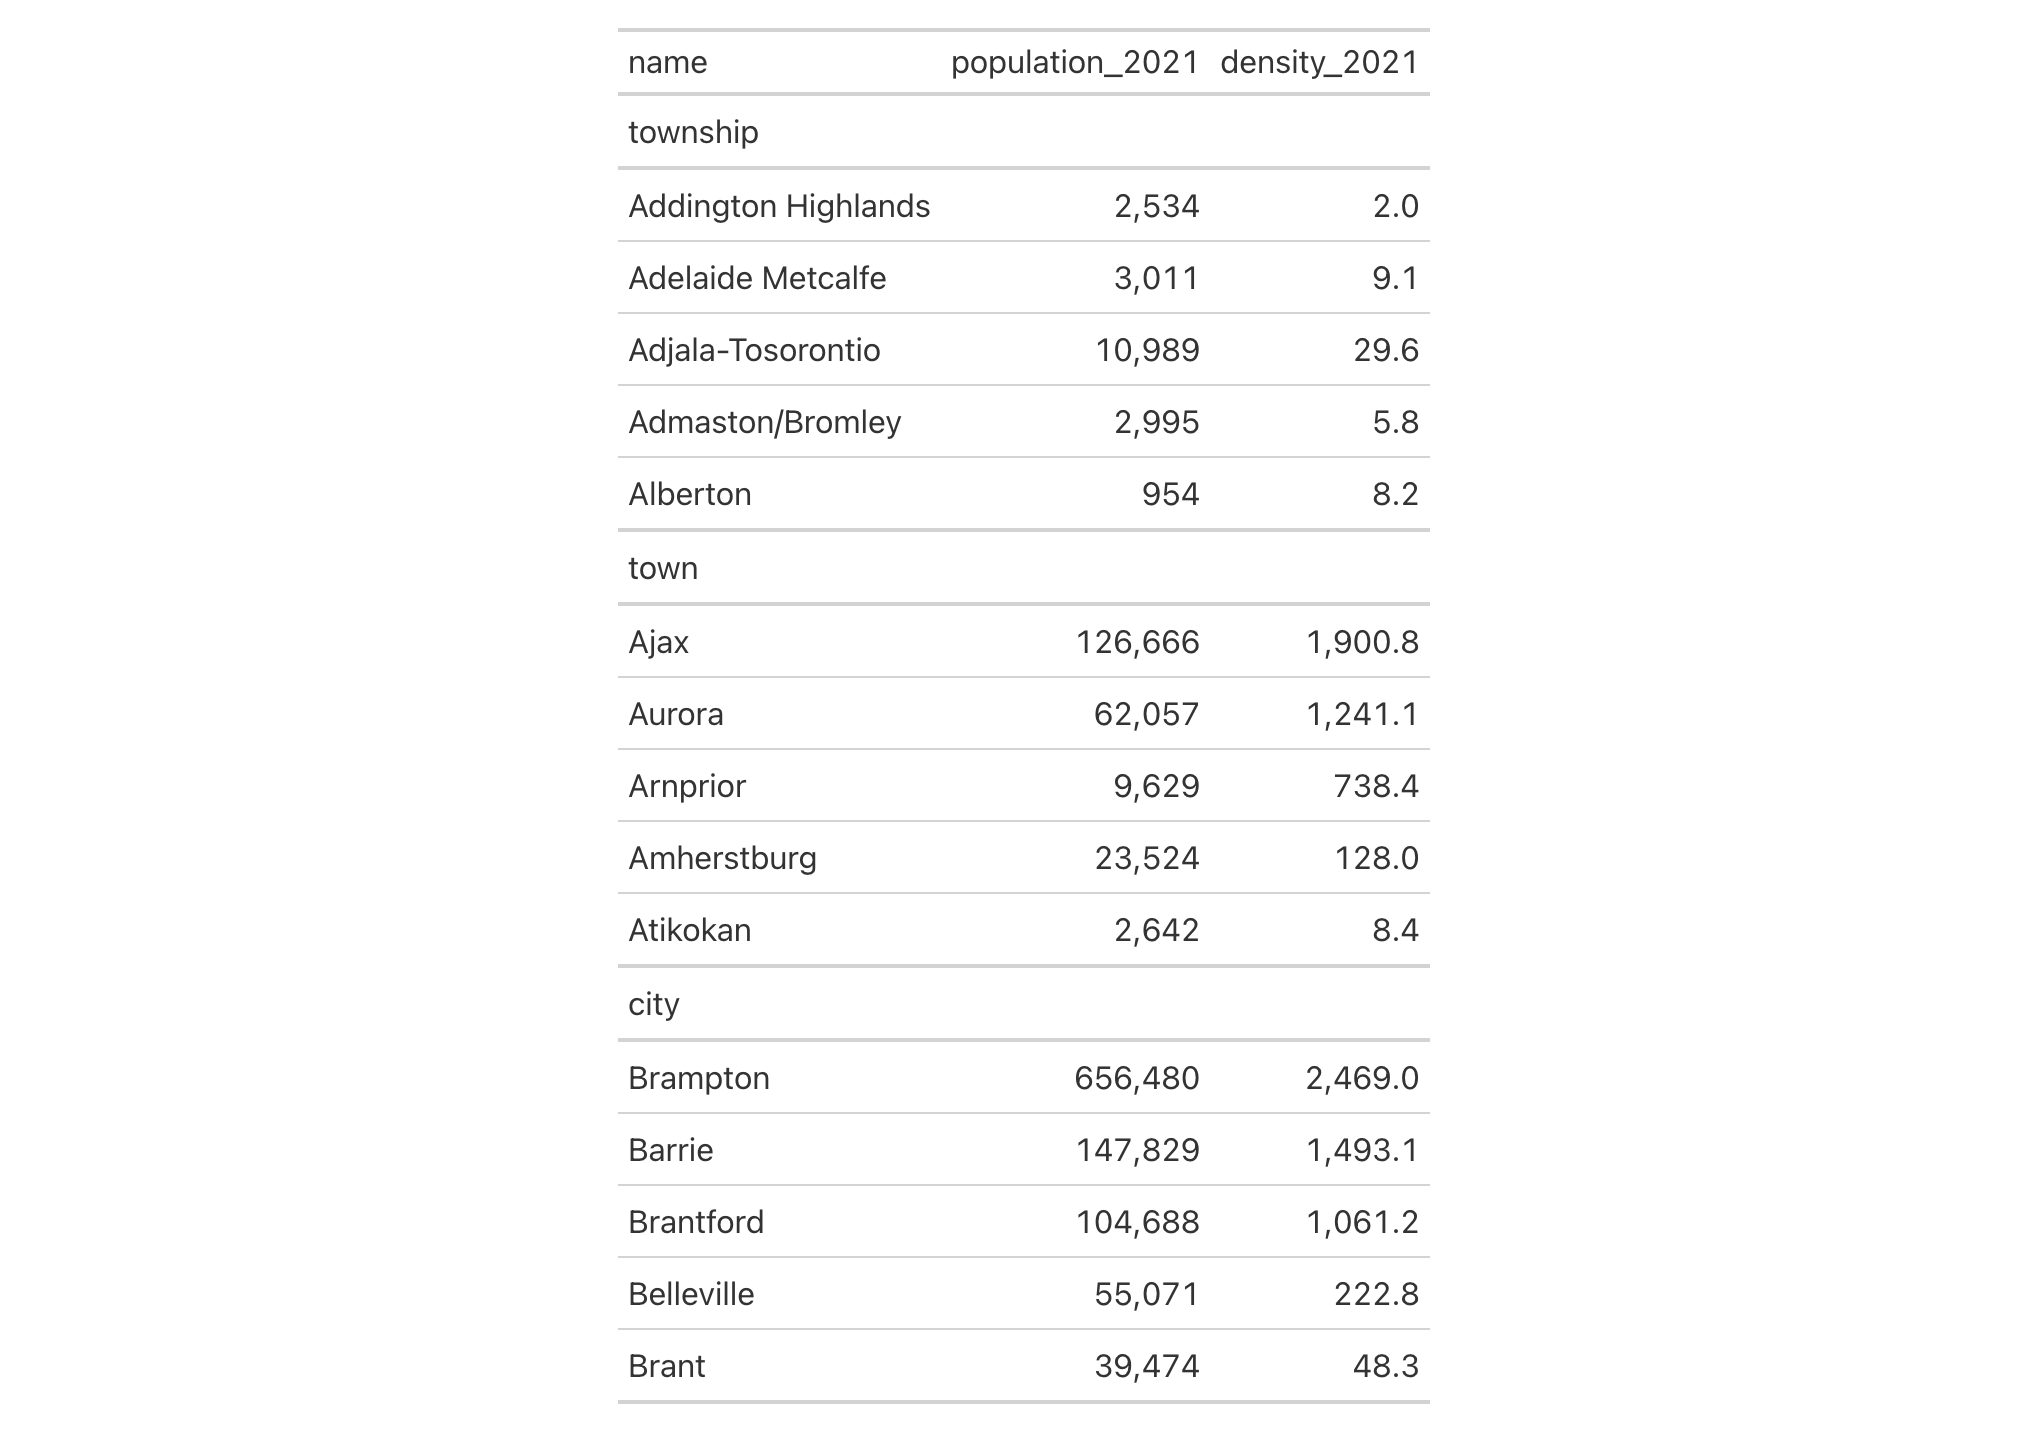
Using towny, we can order rows only within specific groups. Here we
order Ontario municipalities by population density in 2021, but only for
the "city" and "town" groups (leaving "township" rows in their original
order):
towny |>
  dplyr::filter(csd_type %in% c("city", "town", "township")) |>
  dplyr::select(name, csd_type, population_2021, density_2021) |>
  dplyr::slice_head(n = 5, by = csd_type) |>
  gt(groupname_col = "csd_type") |>
  fmt_integer(columns = population_2021) |>
  fmt_number(columns = density_2021, decimals = 1) |>
  row_order(density_2021, groups = c("city", "town"), reverse = TRUE)
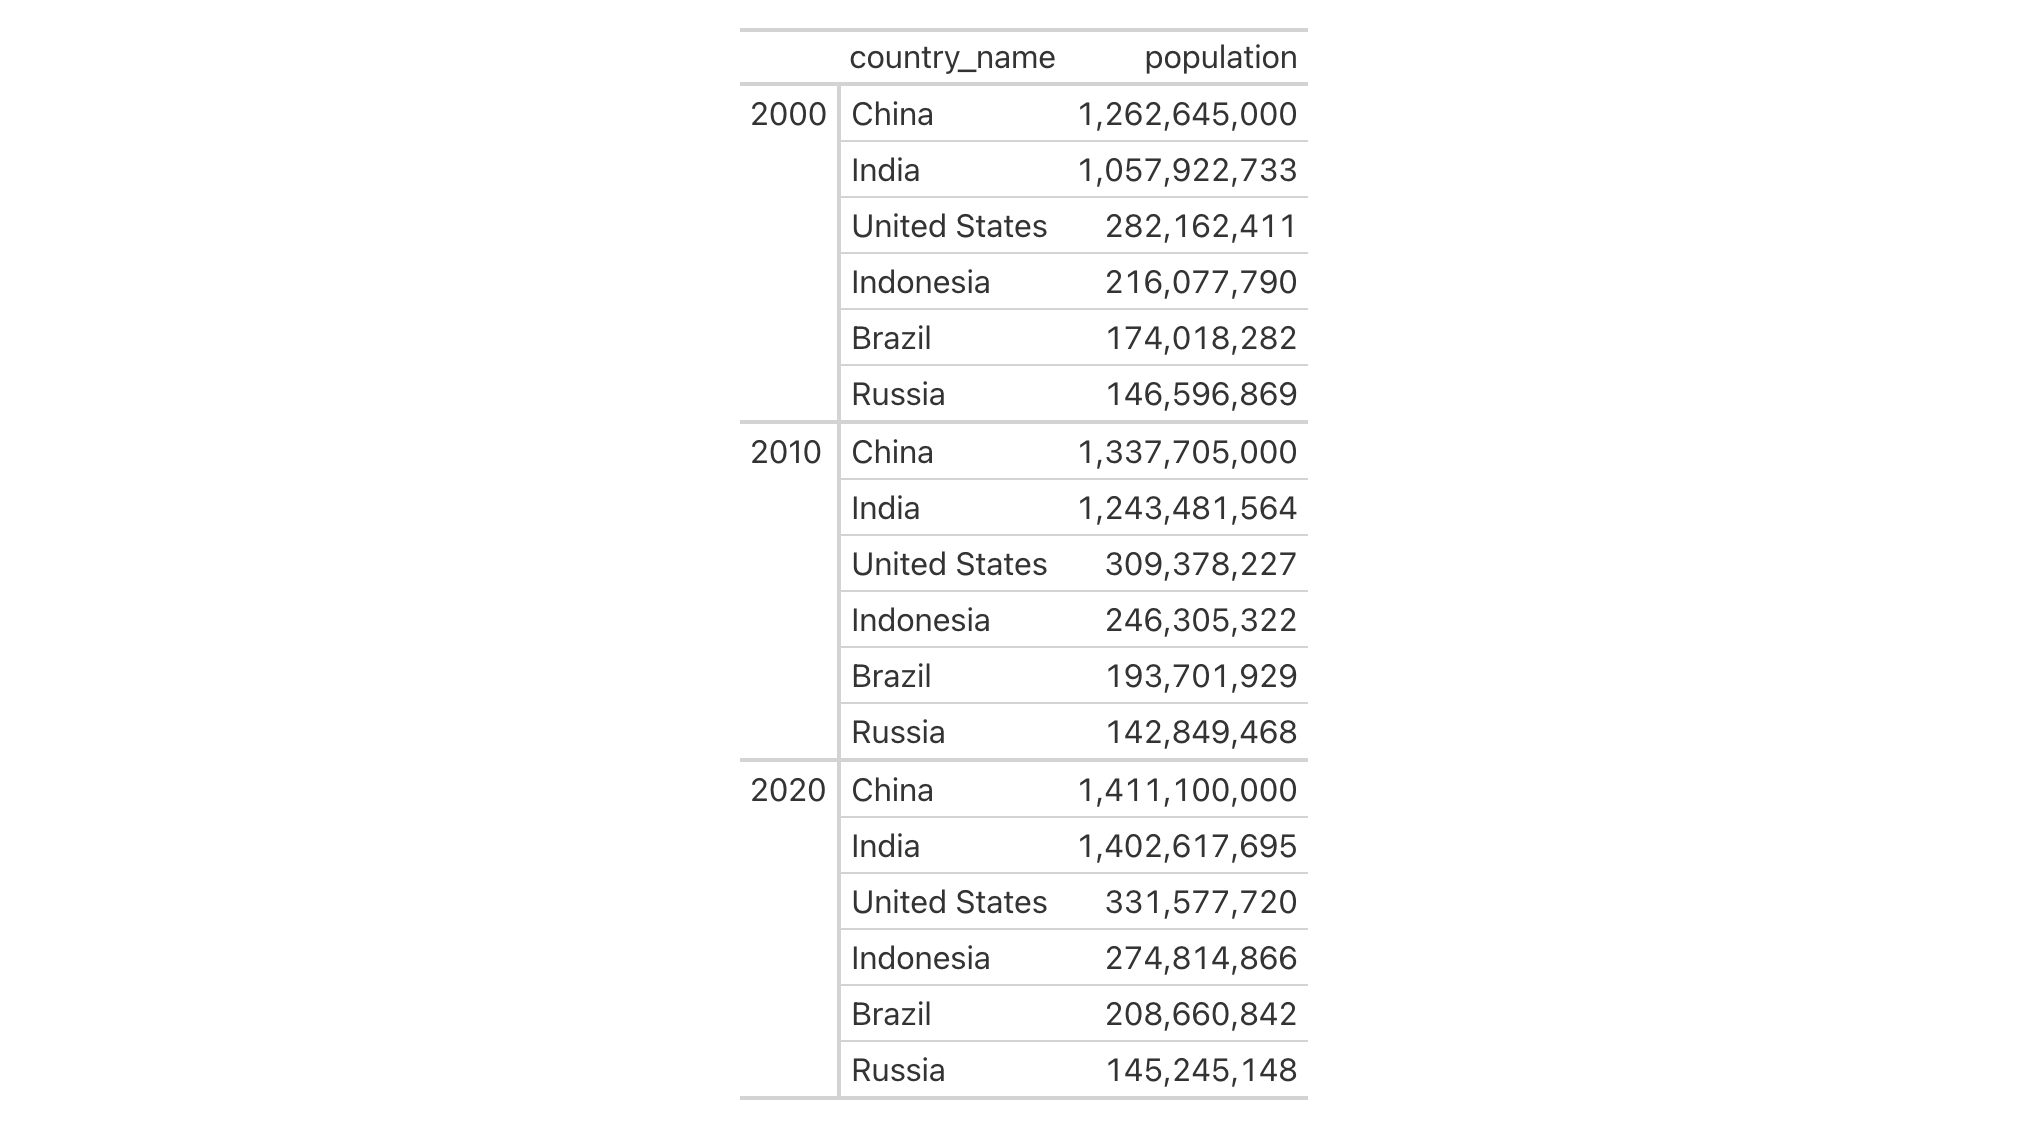
Using countrypops, multiple sorting columns can be specified for
hierarchical ordering. Here we create a table grouped by year, and sort
countries by population within each year:
countrypops |>
  filter(country_code_2 %in% c("BR", "RU", "IN", "CN", "US", "ID")) |>
  filter(year %in% c(2000, 2010, 2020)) |>
  select(year, country_name, population) |>
  gt(groupname_col = "year", row_group_as_column = TRUE) |>
  fmt_integer(columns = population) |>
  row_order(population, reverse = TRUE) |>
  opt_vertical_padding(scale = 0.5)
Function ID
6-4
Function Introduced
In Development
See Also
row_group_order(), which orders the groups themselves.
Other row addition/modification functions:
grand_summary_rows(),
row_group_order(),
rows_add(),
summary_columns(),
summary_rows()
gt documentation built on Jan. 22, 2026, 9:07 a.m.
R Package Documentation
Browse R Packages
We want your feedback!
Note that we can't provide technical support on individual packages. You should contact the package authors for that.
| row_order | R Documentation |
Modify the order of rows within groups
Description
We can modify the display order of rows within any row groups in a gt
object with row_order(). One or more column names can be provided to define
the sorting criteria. By default, rows are sorted in ascending order; use
reverse = TRUE to sort in descending order. The ordering is applied lazily
during the table build phase, ensuring it works alongside other row-reordering
operations.
Usage
row_order(data, ..., groups = NULL, reverse = FALSE)
Arguments
data |
The gt table data object
This is the gt table object that is commonly created through use of the
|
... |
Column expressions for ordering
Column names or expressions describing how to order the rows. Multiple columns can be specified for hierarchical sorting, where the first column is the primary sort key. |
groups |
Specification of row group IDs
An optional character vector of row group ID values to target. If |
reverse |
Reverse the sort order
Should the sort order be reversed (i.e., descending)? By default this is
|
Value
An object of class gt_tbl.
Examples
Let's use the gtcars dataset to demonstrate row ordering within groups.
We'll create a gt table grouped by country and then order rows within
each group by the car price in descending order.
gtcars |>
dplyr::select(mfr, model, ctry_origin, msrp) |>
dplyr::filter(ctry_origin %in% c("Japan", "United Kingdom")) |>
dplyr::slice_head(n = 12) |>
gt(groupname_col = "ctry_origin") |>
row_order(msrp, reverse = TRUE) |>
fmt_currency(columns = msrp, decimals = 0) |>
tab_options(column_labels.hidden = TRUE)
Using towny, we can order rows only within specific groups. Here we
order Ontario municipalities by population density in 2021, but only for
the "city" and "town" groups (leaving "township" rows in their original
order):
towny |>
dplyr::filter(csd_type %in% c("city", "town", "township")) |>
dplyr::select(name, csd_type, population_2021, density_2021) |>
dplyr::slice_head(n = 5, by = csd_type) |>
gt(groupname_col = "csd_type") |>
fmt_integer(columns = population_2021) |>
fmt_number(columns = density_2021, decimals = 1) |>
row_order(density_2021, groups = c("city", "town"), reverse = TRUE)
Using countrypops, multiple sorting columns can be specified for
hierarchical ordering. Here we create a table grouped by year, and sort
countries by population within each year:
countrypops |>
filter(country_code_2 %in% c("BR", "RU", "IN", "CN", "US", "ID")) |>
filter(year %in% c(2000, 2010, 2020)) |>
select(year, country_name, population) |>
gt(groupname_col = "year", row_group_as_column = TRUE) |>
fmt_integer(columns = population) |>
row_order(population, reverse = TRUE) |>
opt_vertical_padding(scale = 0.5)
Function ID
6-4
Function Introduced
In Development
See Also
row_group_order(), which orders the groups themselves.
Other row addition/modification functions:
grand_summary_rows(),
row_group_order(),
rows_add(),
summary_columns(),
summary_rows()
R Package Documentation
Browse R Packages
We want your feedback!
Note that we can't provide technical support on individual packages. You should contact the package authors for that.
Embedding an R snippet on your website
Add the following code to your website.
For more information on customizing the embed code, read Embedding Snippets.