In montilab/K2Taxonomer: Creating annotated submodules of high-throughput data through recursive partitioning
knitr::opts_chunk$set(
    collapse=TRUE,
    comment="#>",
    message=FALSE,
    warning=FALSE,
    eval=FALSE
)
Introduction
To facilitate the comprehensive interrogation the output of
r Githubpkg("montilab/K2Taxonomer") this package includes functionality for
generating interactive dashboards, which include full compendia of results
[@reed_2020]. In addition to the partition-level molecular comparisons included
in these dashboards, they include functionality for performing molecular
comparisons of gene expression and gene set enrichment on user-specified sets
of two-or-more subgroups. In this vignette we describe the steps for creating, editing, and navigating interactive
dashoboards from the output of the r Githubpkg("montilab/K2Taxonomer")
workflow [@reed_2020]. For a more detailed description for running
r Githubpkg("montilab/K2Taxonomer") visit the vignettes describing single-cell and
single-cell workflows
here,
and
here,
respectively.
Requirements
Load packages
## K2Taxonomer package
library(K2Taxonomer)

## Seurat package
library(Seurat)

## For drawing dendrograms
library(ggdendro)
Run K2Taxonomer workflow (Single-cell Example)
Read in single-cell RNAseq data
data("ifnb_small")
Read in gene sets for subgroup annotation
data("cellMarker2_genesets")
Get necessary data objects
## Integrated expression matrix used for clustering data
integrated_expression_matrix <- ifnb_small@assays$integrated$scale.data

## Normalized expression matrix to be used for downstream analyses
normalized_expression_matrix <- ifnb_small@assays$SCT$data

## Profile-level information
cell_data <- ifnb_small@meta.data
Run K2Taxonomer workflow
# Initialize `K2` object
K2res <- K2preproc(object = integrated_expression_matrix,
                   eMatDS = normalized_expression_matrix,
                   colData = cell_data,
                   cohorts="cell_type",
                   nBoots = 200,
                   clustFunc = "cKmeansDownsampleSqrt",
                   genesets = cellMarker2_genesets)

# Perform recursive partitioning
K2res <- K2tax(K2res)

# Partition-level differential gene expression
K2res <- runDGEmods(K2res)

### Perform Fisher Exact Test based over-representation analysis
K2res <- runFISHERmods(K2res)

### Perform single-sample gene set scoring
K2res <- runScoreGeneSets(K2res)

### Perform partition-level differential gene set score analysis
K2res <- runDSSEmods(K2res)
Check partitioning results
## Get dendrogram from K2Taxonomer
dendro <- K2dendro(K2res)

## Plot dendrogram
ggdendrogram(dendro)
Creating a dashboard
We generate the interactive dashboards with the K2dashboard() function. This
function will create a directory with two files. These two files include the
interactive RMarkdown (.Rmd) file created by the r CRANpkg("flexdashboard")
package and the R object (.rds) file containing the K2 object created by
r Githubpkg("montilab/K2Taxonomer") functions.
Below we shown the K2dashboard() function and each of its arguments.
The first argument, specifying the K2 object is the only requirement. The
remaining three arguments costumize the output, as follows:
-
analysis_name: Specifies the title to be printed on the top of the
dashboard. Also, specifies the prefix of the name of the output files. For
filenames, spaces are replaced by underscores.
-
about: Logical specifying whether to include an about page in the
dashboard. If TRUE (default), a third file is written to the dashboard
directory, "about.md". This is an editable markdown (.md) file, which the
user is free to edit, and includes some default information about where to
learn more about r Githubpkg("montilab/K2Taxonomer") and how to navigate the
dashboard. Customizing this file is described in more detail below.
-
output_dir: This is simply the path to the directory to write the
dashboard directory.
K2dashboard(K2res,
            analysis_name="K2Taxonomer Example",
            about=TRUE,
            output_dir=".")
Additional considerations
The output directory
To prevent the overwriting of dashboard files, in addition to the
analysis_name, the name of dashboard directory includes the date and time.
It is formatted as follows:
analysis_name_YEAR_MONTH_DAY_HOUR_MINUTE_SECOND.INTEGER
Note: Changing the name of this directory does not effect the dashboard.
The "about.md" file
r Githubpkg("montilab/K2Taxonomer") allows users to include information about
their study in the interactive dashboards by editing" the "about.md"
markdown file. When the "about.md" is included in the dashboard
directory, it is read in and the markdown code is compiled along with the
code in the dashboard file.
This file uses markdown syntax specific to the CRANpkg("flexdashboard")
"Multiple Pages" layout, which can be reviewed
here. Mainly, the
first two lines of the default "about.md" file.
about
=====================================
Will result in a tab, named About, as the first tab in the dashboard.
Furthermore, lines with headers should start at three hashes, "###".
Finally, when including links in the "about.md" file, make sure that
clicking on these links opens a new window using the following:
[TEXT](URL){target="_blank"}
Otherwise, the dashboard will need to reload upon navigating back.
Navigating dashboards
r Githubpkg("montilab/K2Taxonomer") dashboards comprise three tabs,
described below:
-
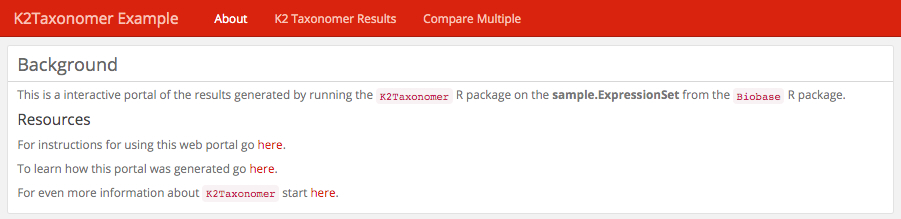
About: This optional tab with which the user can include
information about the analysis being performed. This page is populated by a
file, "about.md", included in the same directory as the dashboard file.
More information about formatting this file can be found
here.
-
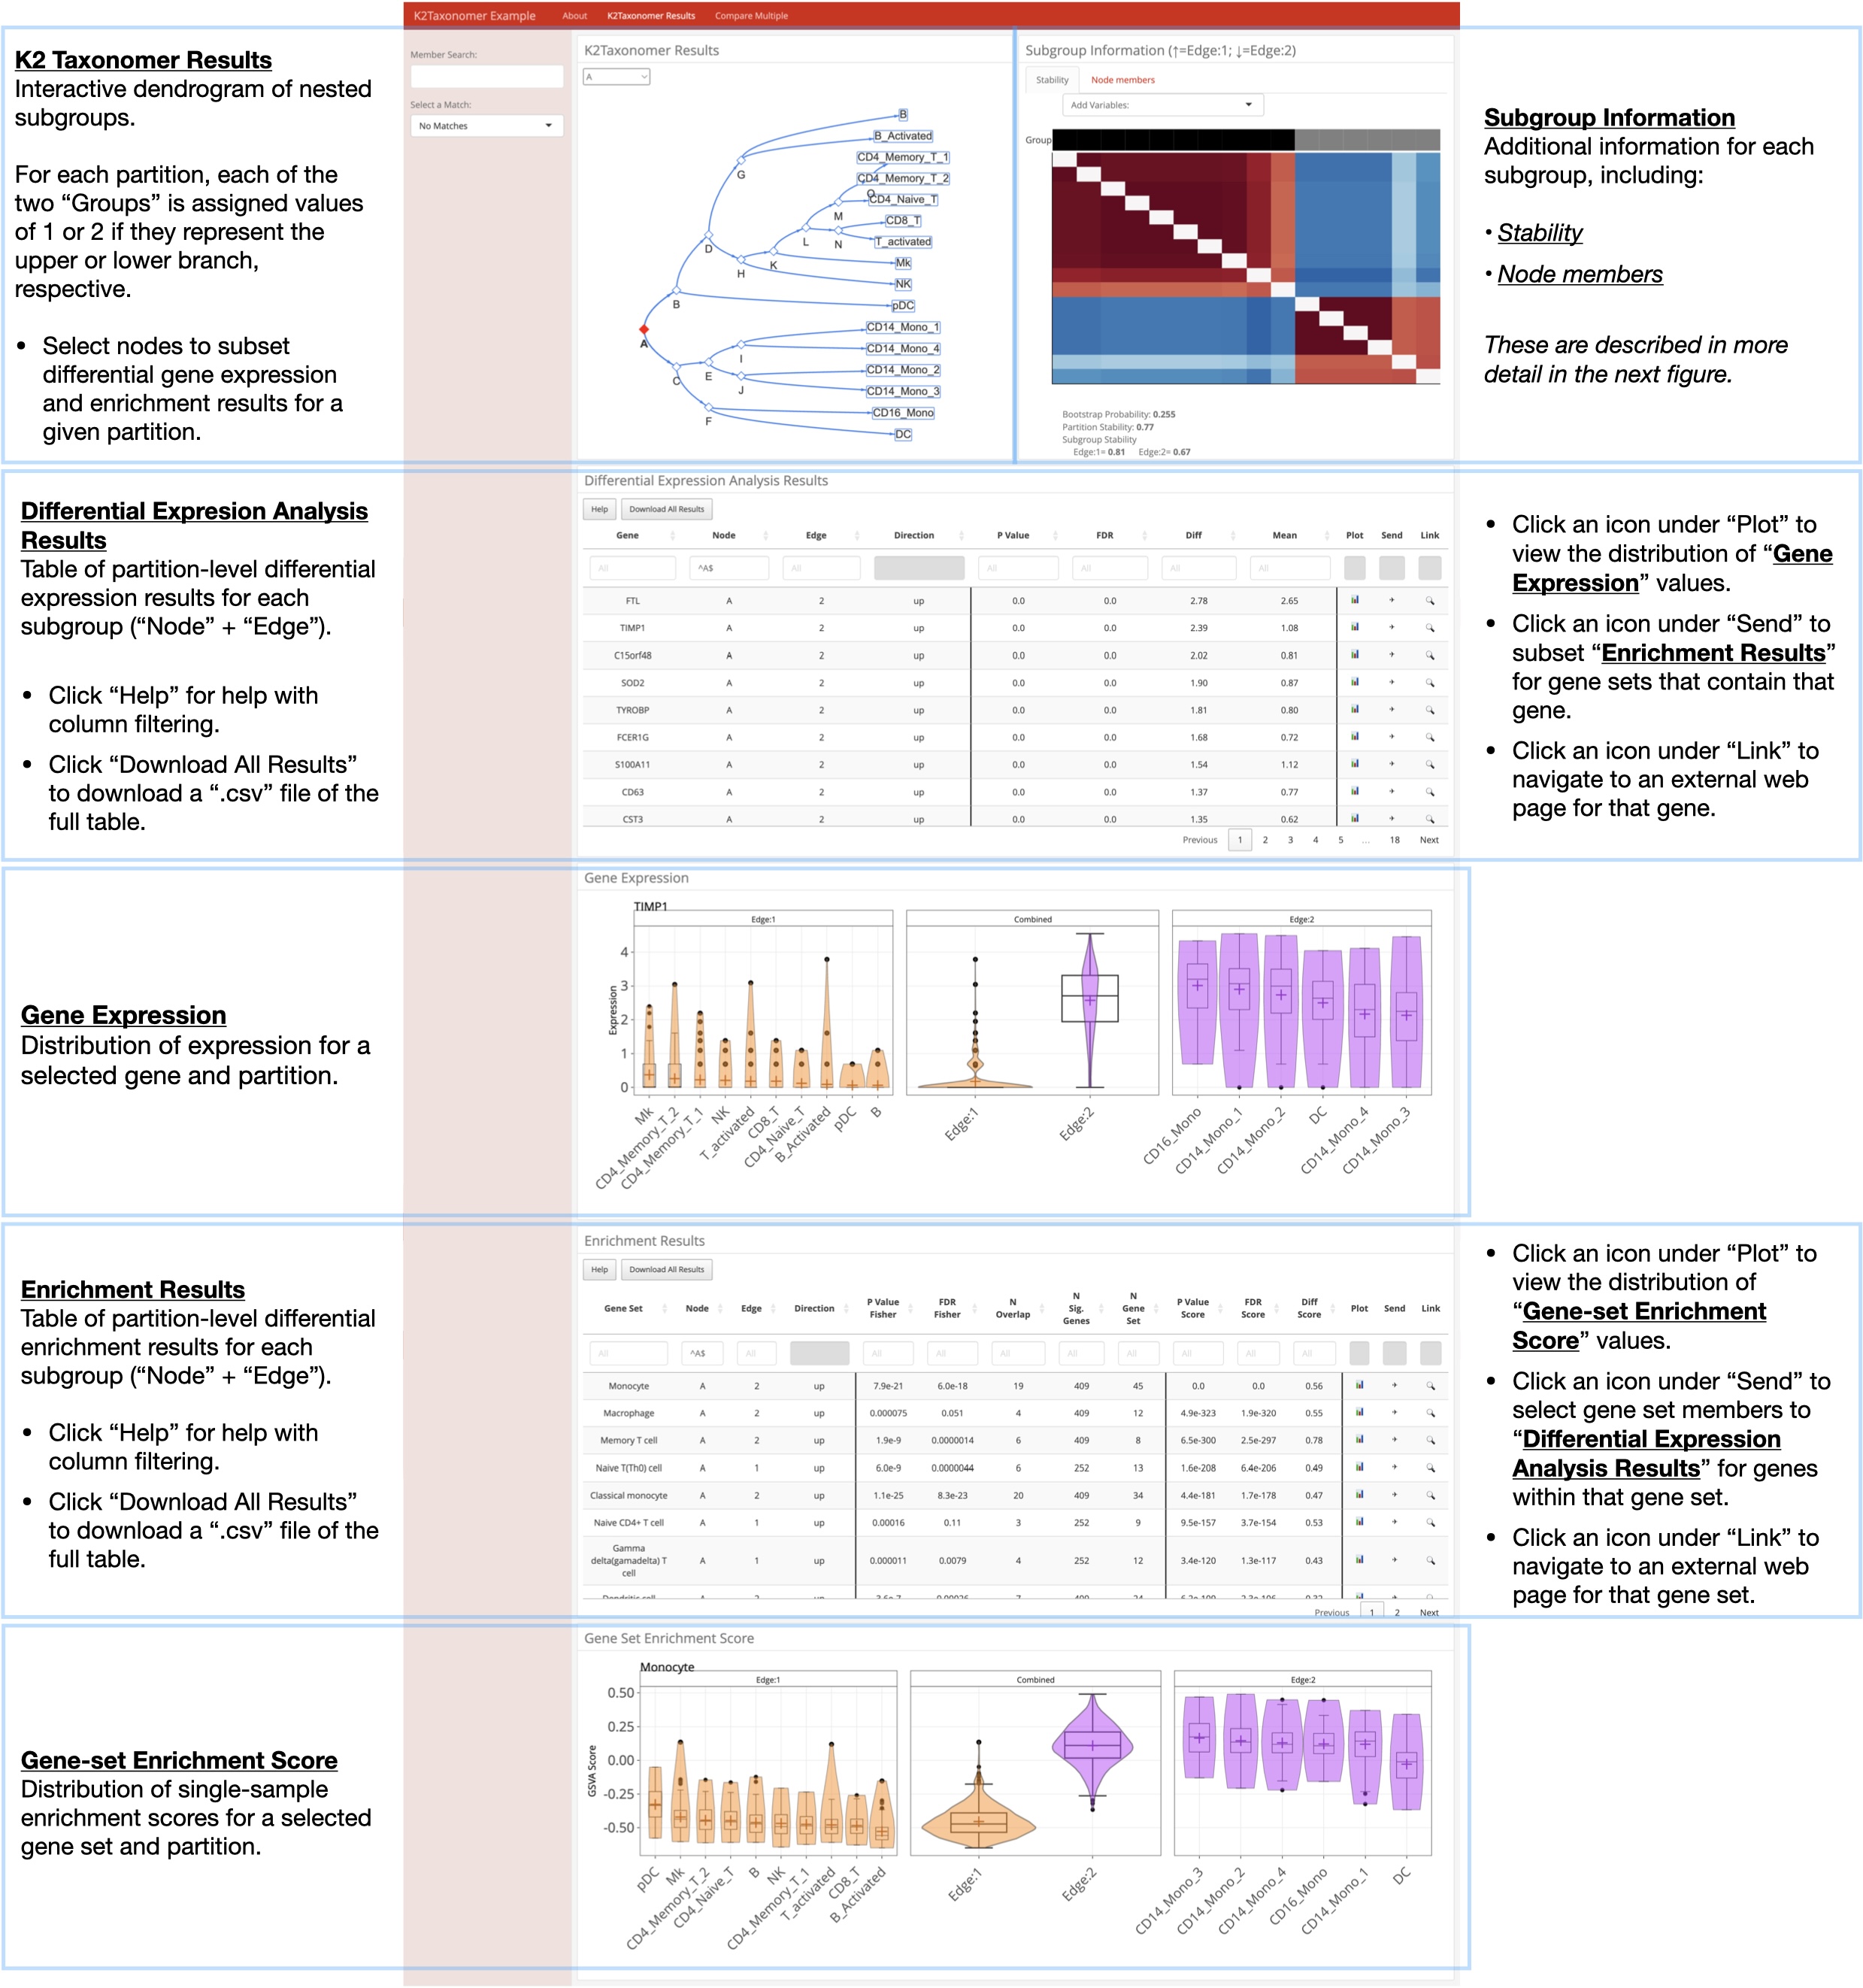
K2Taxonomer Results: This tab includes all of the results generated
throughout the r Githubpkg("montilab/K2Taxonomer") workflow, including:
partitioning results, partition stability, gene expression analysis,
gene set enrichment, and phenotypic variable testing (optional).
More information for how r Githubpkg("montilab/K2Taxonomer") estimates these
results can be found
here.
-
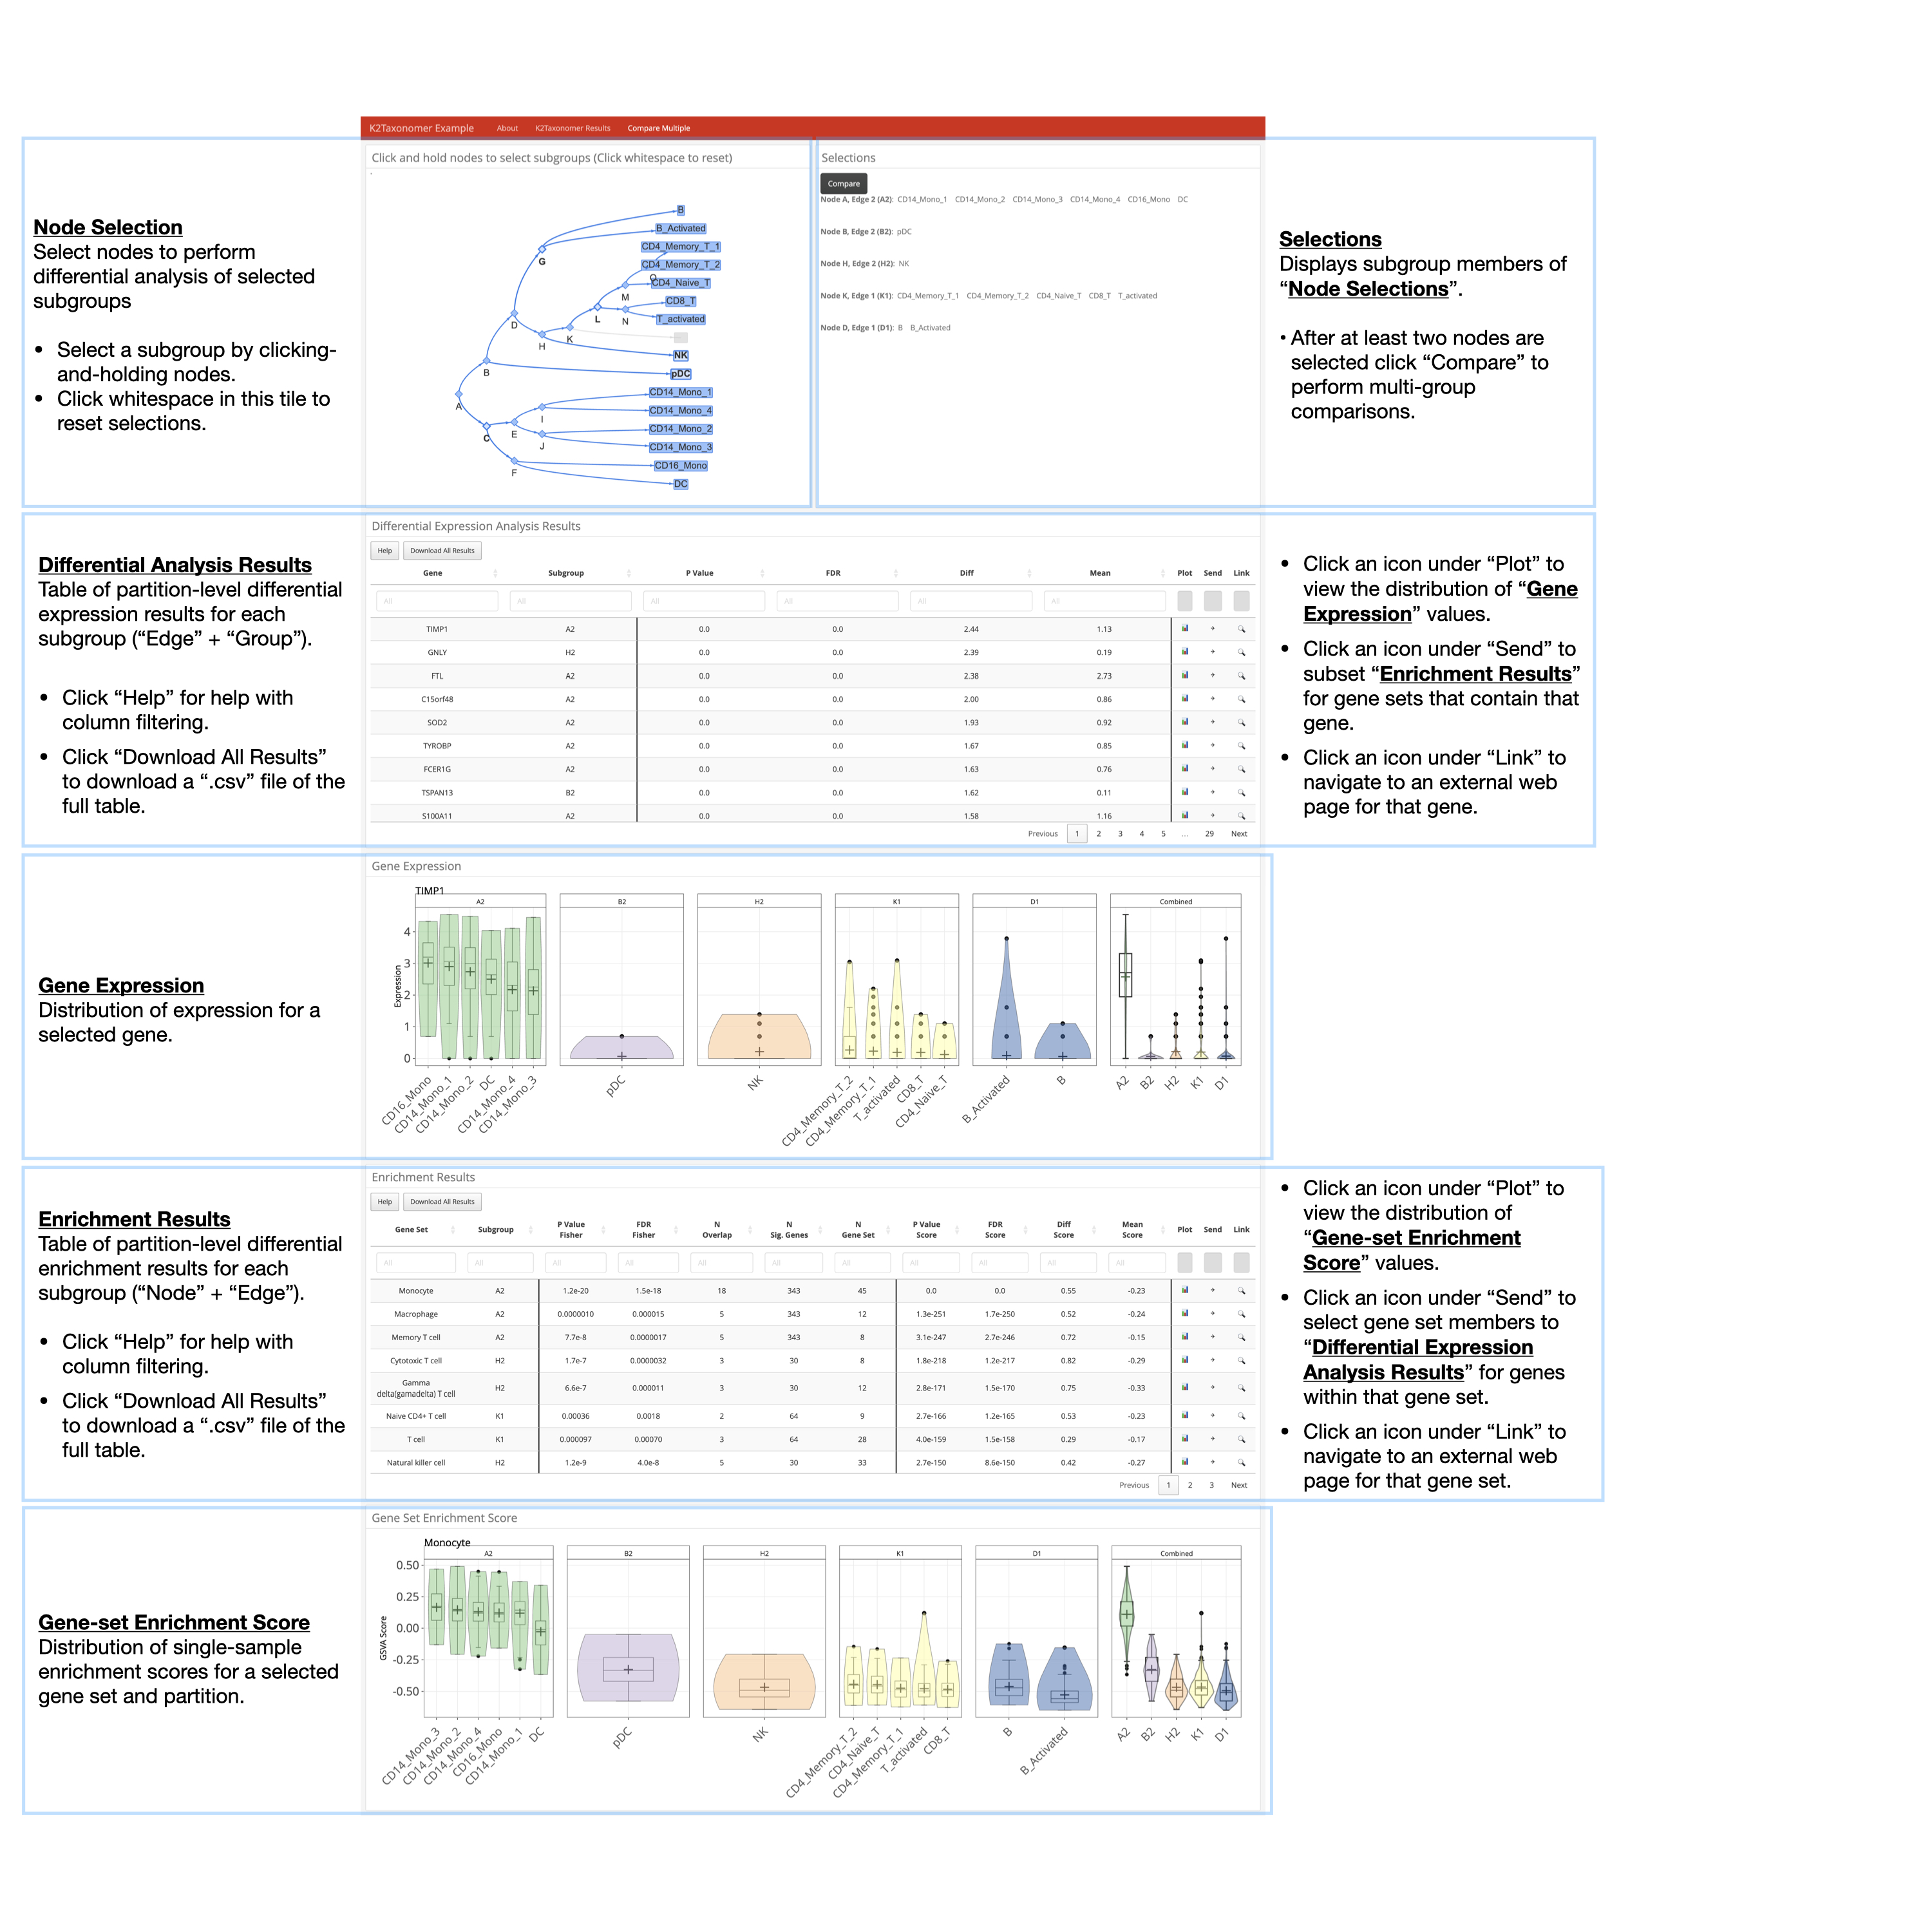
Compare Multiple: This tab allows the user to perform additional
molecular comparisons between subgroups, beyond the partition-level comparisons
performed by r Githubpkg("montilab/K2Taxonomer") functions.
Annotation of each of these tabs is presented below. Click on any of these
images to view in higher resolution
About

r Githubpkg("montilab/K2Taxonomer") Results

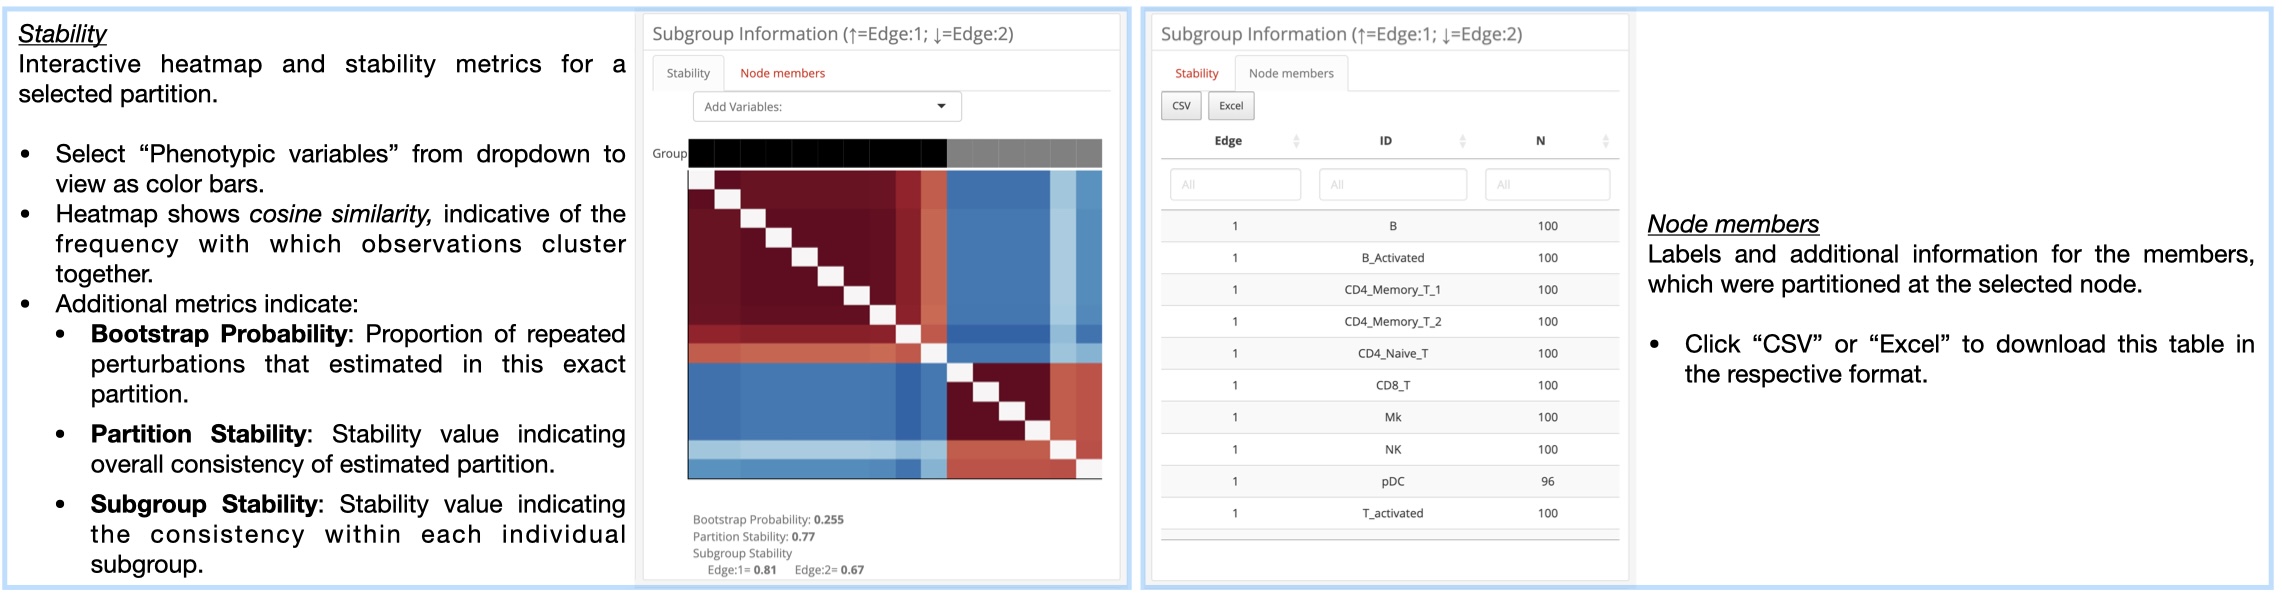
Subgroup Information

Compare Multiple

References
montilab/K2Taxonomer documentation built on April 5, 2025, 3:58 a.m.
R Package Documentation
Browse R Packages
We want your feedback!
Note that we can't provide technical support on individual packages. You should contact the package authors for that.
knitr::opts_chunk$set( collapse=TRUE, comment="#>", message=FALSE, warning=FALSE, eval=FALSE )
Introduction
To facilitate the comprehensive interrogation the output of
r Githubpkg("montilab/K2Taxonomer") this package includes functionality for
generating interactive dashboards, which include full compendia of results
[@reed_2020]. In addition to the partition-level molecular comparisons included
in these dashboards, they include functionality for performing molecular
comparisons of gene expression and gene set enrichment on user-specified sets
of two-or-more subgroups. In this vignette we describe the steps for creating, editing, and navigating interactive
dashoboards from the output of the r Githubpkg("montilab/K2Taxonomer")
workflow [@reed_2020]. For a more detailed description for running
r Githubpkg("montilab/K2Taxonomer") visit the vignettes describing single-cell and
single-cell workflows
here,
and
here,
respectively.
Requirements
Load packages
## K2Taxonomer package library(K2Taxonomer) ## Seurat package library(Seurat) ## For drawing dendrograms library(ggdendro)
Run K2Taxonomer workflow (Single-cell Example)
Read in single-cell RNAseq data
data("ifnb_small")
Read in gene sets for subgroup annotation
data("cellMarker2_genesets")
Get necessary data objects
## Integrated expression matrix used for clustering data integrated_expression_matrix <- ifnb_small@assays$integrated$scale.data ## Normalized expression matrix to be used for downstream analyses normalized_expression_matrix <- ifnb_small@assays$SCT$data ## Profile-level information cell_data <- ifnb_small@meta.data
Run K2Taxonomer workflow
# Initialize `K2` object K2res <- K2preproc(object = integrated_expression_matrix, eMatDS = normalized_expression_matrix, colData = cell_data, cohorts="cell_type", nBoots = 200, clustFunc = "cKmeansDownsampleSqrt", genesets = cellMarker2_genesets) # Perform recursive partitioning K2res <- K2tax(K2res) # Partition-level differential gene expression K2res <- runDGEmods(K2res) ### Perform Fisher Exact Test based over-representation analysis K2res <- runFISHERmods(K2res) ### Perform single-sample gene set scoring K2res <- runScoreGeneSets(K2res) ### Perform partition-level differential gene set score analysis K2res <- runDSSEmods(K2res)
Check partitioning results
## Get dendrogram from K2Taxonomer dendro <- K2dendro(K2res) ## Plot dendrogram ggdendrogram(dendro)
Creating a dashboard
We generate the interactive dashboards with the K2dashboard() function. This
function will create a directory with two files. These two files include the
interactive RMarkdown (.Rmd) file created by the r CRANpkg("flexdashboard")
package and the R object (.rds) file containing the K2 object created by
r Githubpkg("montilab/K2Taxonomer") functions.
Below we shown the K2dashboard() function and each of its arguments.
The first argument, specifying the K2 object is the only requirement. The
remaining three arguments costumize the output, as follows:
-
analysis_name: Specifies the title to be printed on the top of the dashboard. Also, specifies the prefix of the name of the output files. For filenames, spaces are replaced by underscores.
-
about: Logical specifying whether to include an about page in the dashboard. If TRUE (default), a third file is written to the dashboard directory, "about.md". This is an editable markdown (.md) file, which the user is free to edit, and includes some default information about where to learn more about
r Githubpkg("montilab/K2Taxonomer")and how to navigate the dashboard. Customizing this file is described in more detail below. -
output_dir: This is simply the path to the directory to write the dashboard directory.
K2dashboard(K2res, analysis_name="K2Taxonomer Example", about=TRUE, output_dir=".")
Additional considerations
The output directory
To prevent the overwriting of dashboard files, in addition to the analysis_name, the name of dashboard directory includes the date and time. It is formatted as follows:
Note: Changing the name of this directory does not effect the dashboard.
The "about.md" file
r Githubpkg("montilab/K2Taxonomer") allows users to include information about
their study in the interactive dashboards by editing" the "about.md"
markdown file. When the "about.md" is included in the dashboard
directory, it is read in and the markdown code is compiled along with the
code in the dashboard file.
This file uses markdown syntax specific to the CRANpkg("flexdashboard") "Multiple Pages" layout, which can be reviewed here. Mainly, the first two lines of the default "about.md" file.
about =====================================
Will result in a tab, named About, as the first tab in the dashboard. Furthermore, lines with headers should start at three hashes, "###".
Finally, when including links in the "about.md" file, make sure that clicking on these links opens a new window using the following:
[TEXT](URL){target="_blank"}
Otherwise, the dashboard will need to reload upon navigating back.
Navigating dashboards
r Githubpkg("montilab/K2Taxonomer") dashboards comprise three tabs,
described below:
-
About: This optional tab with which the user can include information about the analysis being performed. This page is populated by a file, "about.md", included in the same directory as the dashboard file. More information about formatting this file can be found here.
-
K2Taxonomer Results: This tab includes all of the results generated throughout the
r Githubpkg("montilab/K2Taxonomer")workflow, including: partitioning results, partition stability, gene expression analysis, gene set enrichment, and phenotypic variable testing (optional). More information for howr Githubpkg("montilab/K2Taxonomer")estimates these results can be found here. -
Compare Multiple: This tab allows the user to perform additional molecular comparisons between subgroups, beyond the partition-level comparisons performed by
r Githubpkg("montilab/K2Taxonomer")functions.
Annotation of each of these tabs is presented below. Click on any of these images to view in higher resolution
About
r Githubpkg("montilab/K2Taxonomer") Results
Subgroup Information
Compare Multiple
References
R Package Documentation
Browse R Packages
We want your feedback!
Note that we can't provide technical support on individual packages. You should contact the package authors for that.
Embedding an R snippet on your website
Add the following code to your website.
For more information on customizing the embed code, read Embedding Snippets.