Nothing
README.md
In ChIPseeker: ChIPseeker for ChIP peak Annotation, Comparison, and Visualization
ChIPseeker: ChIP peak Annotation, Comparison, and Visualization


This package implements functions to retrieve the nearest genes around
the peak, annotate genomic region of the peak, statstical methods for
estimate the significance of overlap among ChIP peak data sets, and
incorporate GEO database for user to compare their own dataset with
those deposited in database. The comparison can be used to infer
cooperative regulation and thus can be used to generate hypotheses.
Several visualization functions are implemented to summarize the
coverage of the peak experiment, average profile and heatmap of peaks
binding to TSS regions, genomic annotation, distance to TSS, and overlap
of peaks or genes.
For details, please visit our project website,
https://guangchuangyu.github.io/software/ChIPseeker.


Please cite the following article when using ChIPseeker:
Yu G, Wang LG and He QY*. ChIPseeker: an
R/Bioconductor package for ChIP peak annotation, comparison and
visualization. Bioinformatics 2015,
31(14):2382-2383.


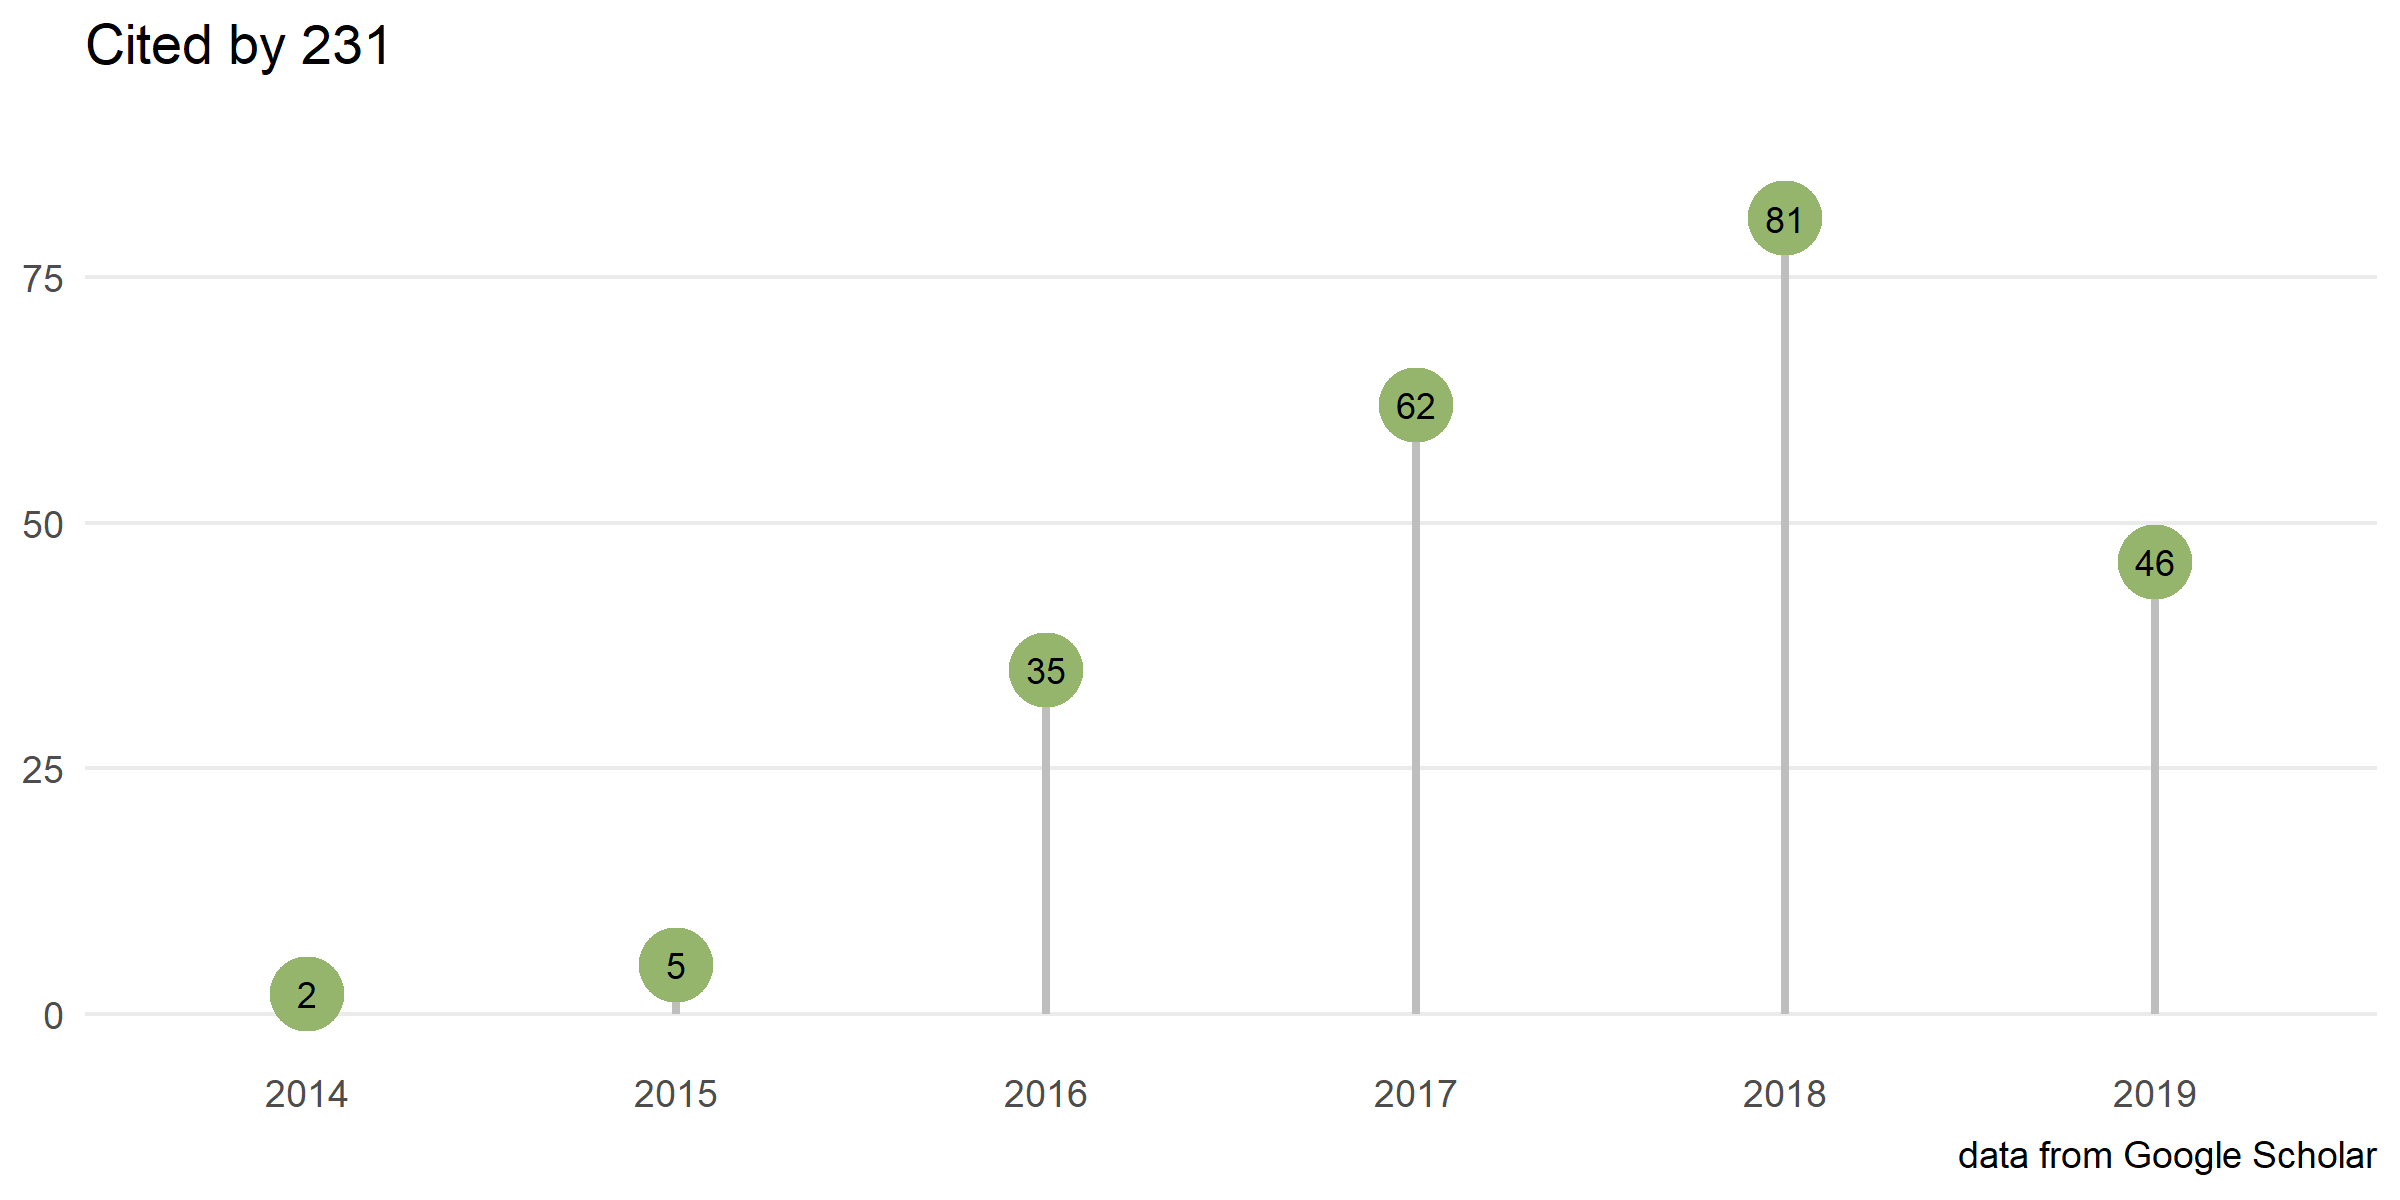
Citation
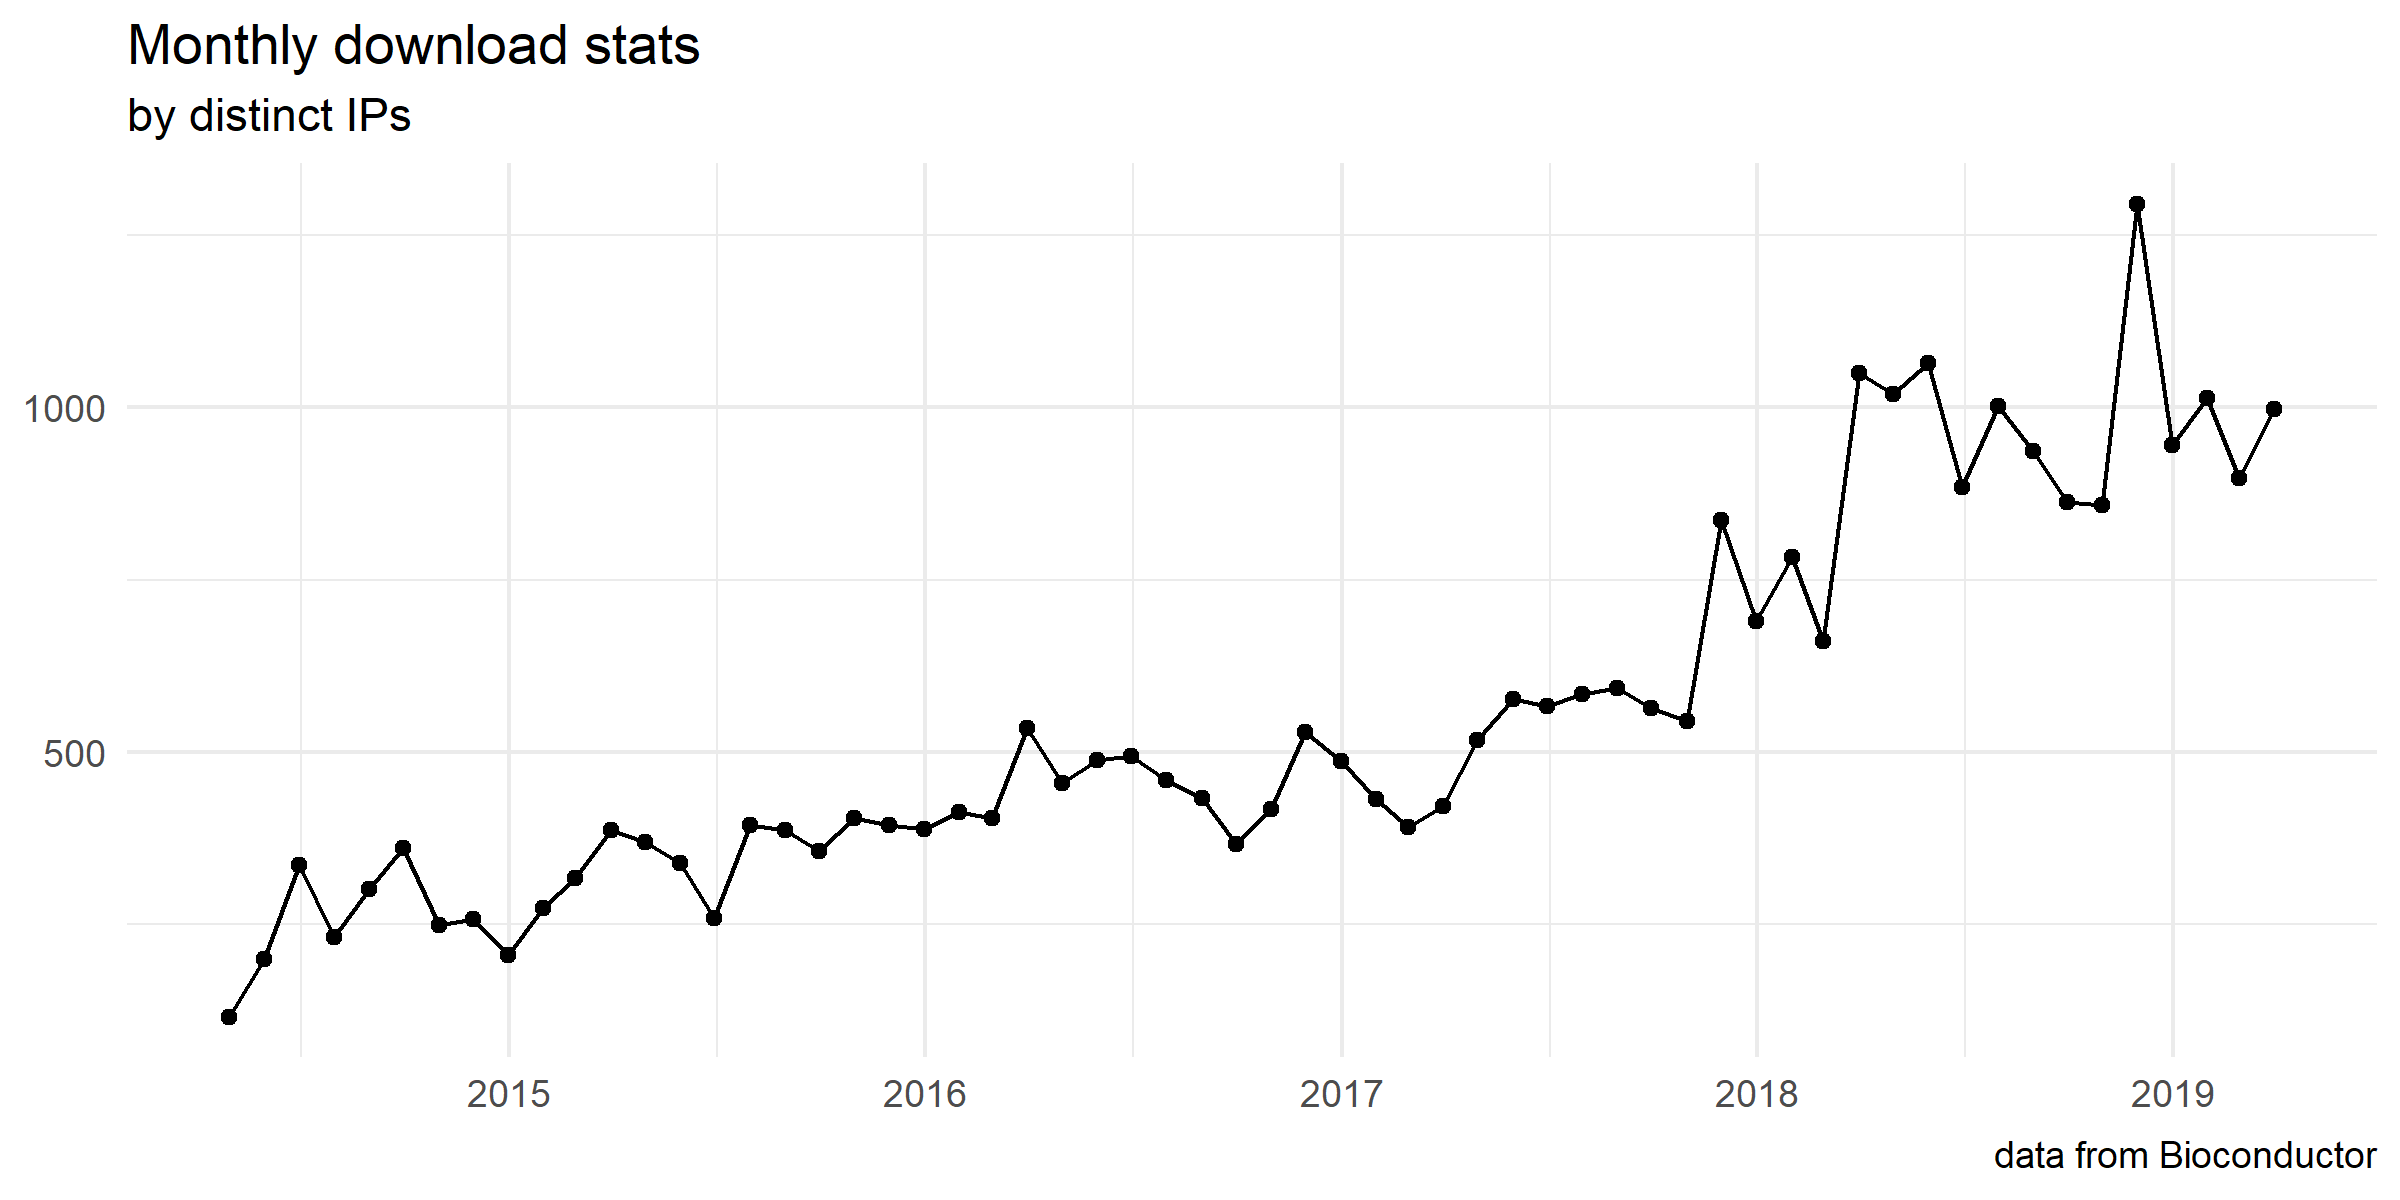
Download stats


Contributing
We welcome any contributions! By participating in this project you
agree to abide by the terms outlined in the Contributor Code of
Conduct.
Try the ChIPseeker package in your browser
Any scripts or data that you put into this service are public.
ChIPseeker documentation built on March 6, 2021, 2 a.m.
R Package Documentation
Browse R Packages
We want your feedback!
Note that we can't provide technical support on individual packages. You should contact the package authors for that.
ChIPseeker: ChIP peak Annotation, Comparison, and Visualization
![]()
![]()
![]()
![]()
![]()
This package implements functions to retrieve the nearest genes around the peak, annotate genomic region of the peak, statstical methods for estimate the significance of overlap among ChIP peak data sets, and incorporate GEO database for user to compare their own dataset with those deposited in database. The comparison can be used to infer cooperative regulation and thus can be used to generate hypotheses. Several visualization functions are implemented to summarize the coverage of the peak experiment, average profile and heatmap of peaks binding to TSS regions, genomic annotation, distance to TSS, and overlap of peaks or genes.
For details, please visit our project website, https://guangchuangyu.github.io/software/ChIPseeker.


Please cite the following article when using ChIPseeker:
Yu G, Wang LG and He QY*. ChIPseeker: an R/Bioconductor package for ChIP peak annotation, comparison and visualization. Bioinformatics 2015, 31(14):2382-2383.
![]()
![]()
Citation
Download stats
![]()
![]()
Contributing
We welcome any contributions! By participating in this project you agree to abide by the terms outlined in the Contributor Code of Conduct.
Try the ChIPseeker package in your browser
Any scripts or data that you put into this service are public.
R Package Documentation
Browse R Packages
We want your feedback!
Note that we can't provide technical support on individual packages. You should contact the package authors for that.
Embedding an R snippet on your website
Add the following code to your website.
For more information on customizing the embed code, read Embedding Snippets.