In Bishop-Laboratory/RLSeq: RLSeq: An analysis package for R-loop mapping data
r i. r names(resAnchor) {#r resAnchor}
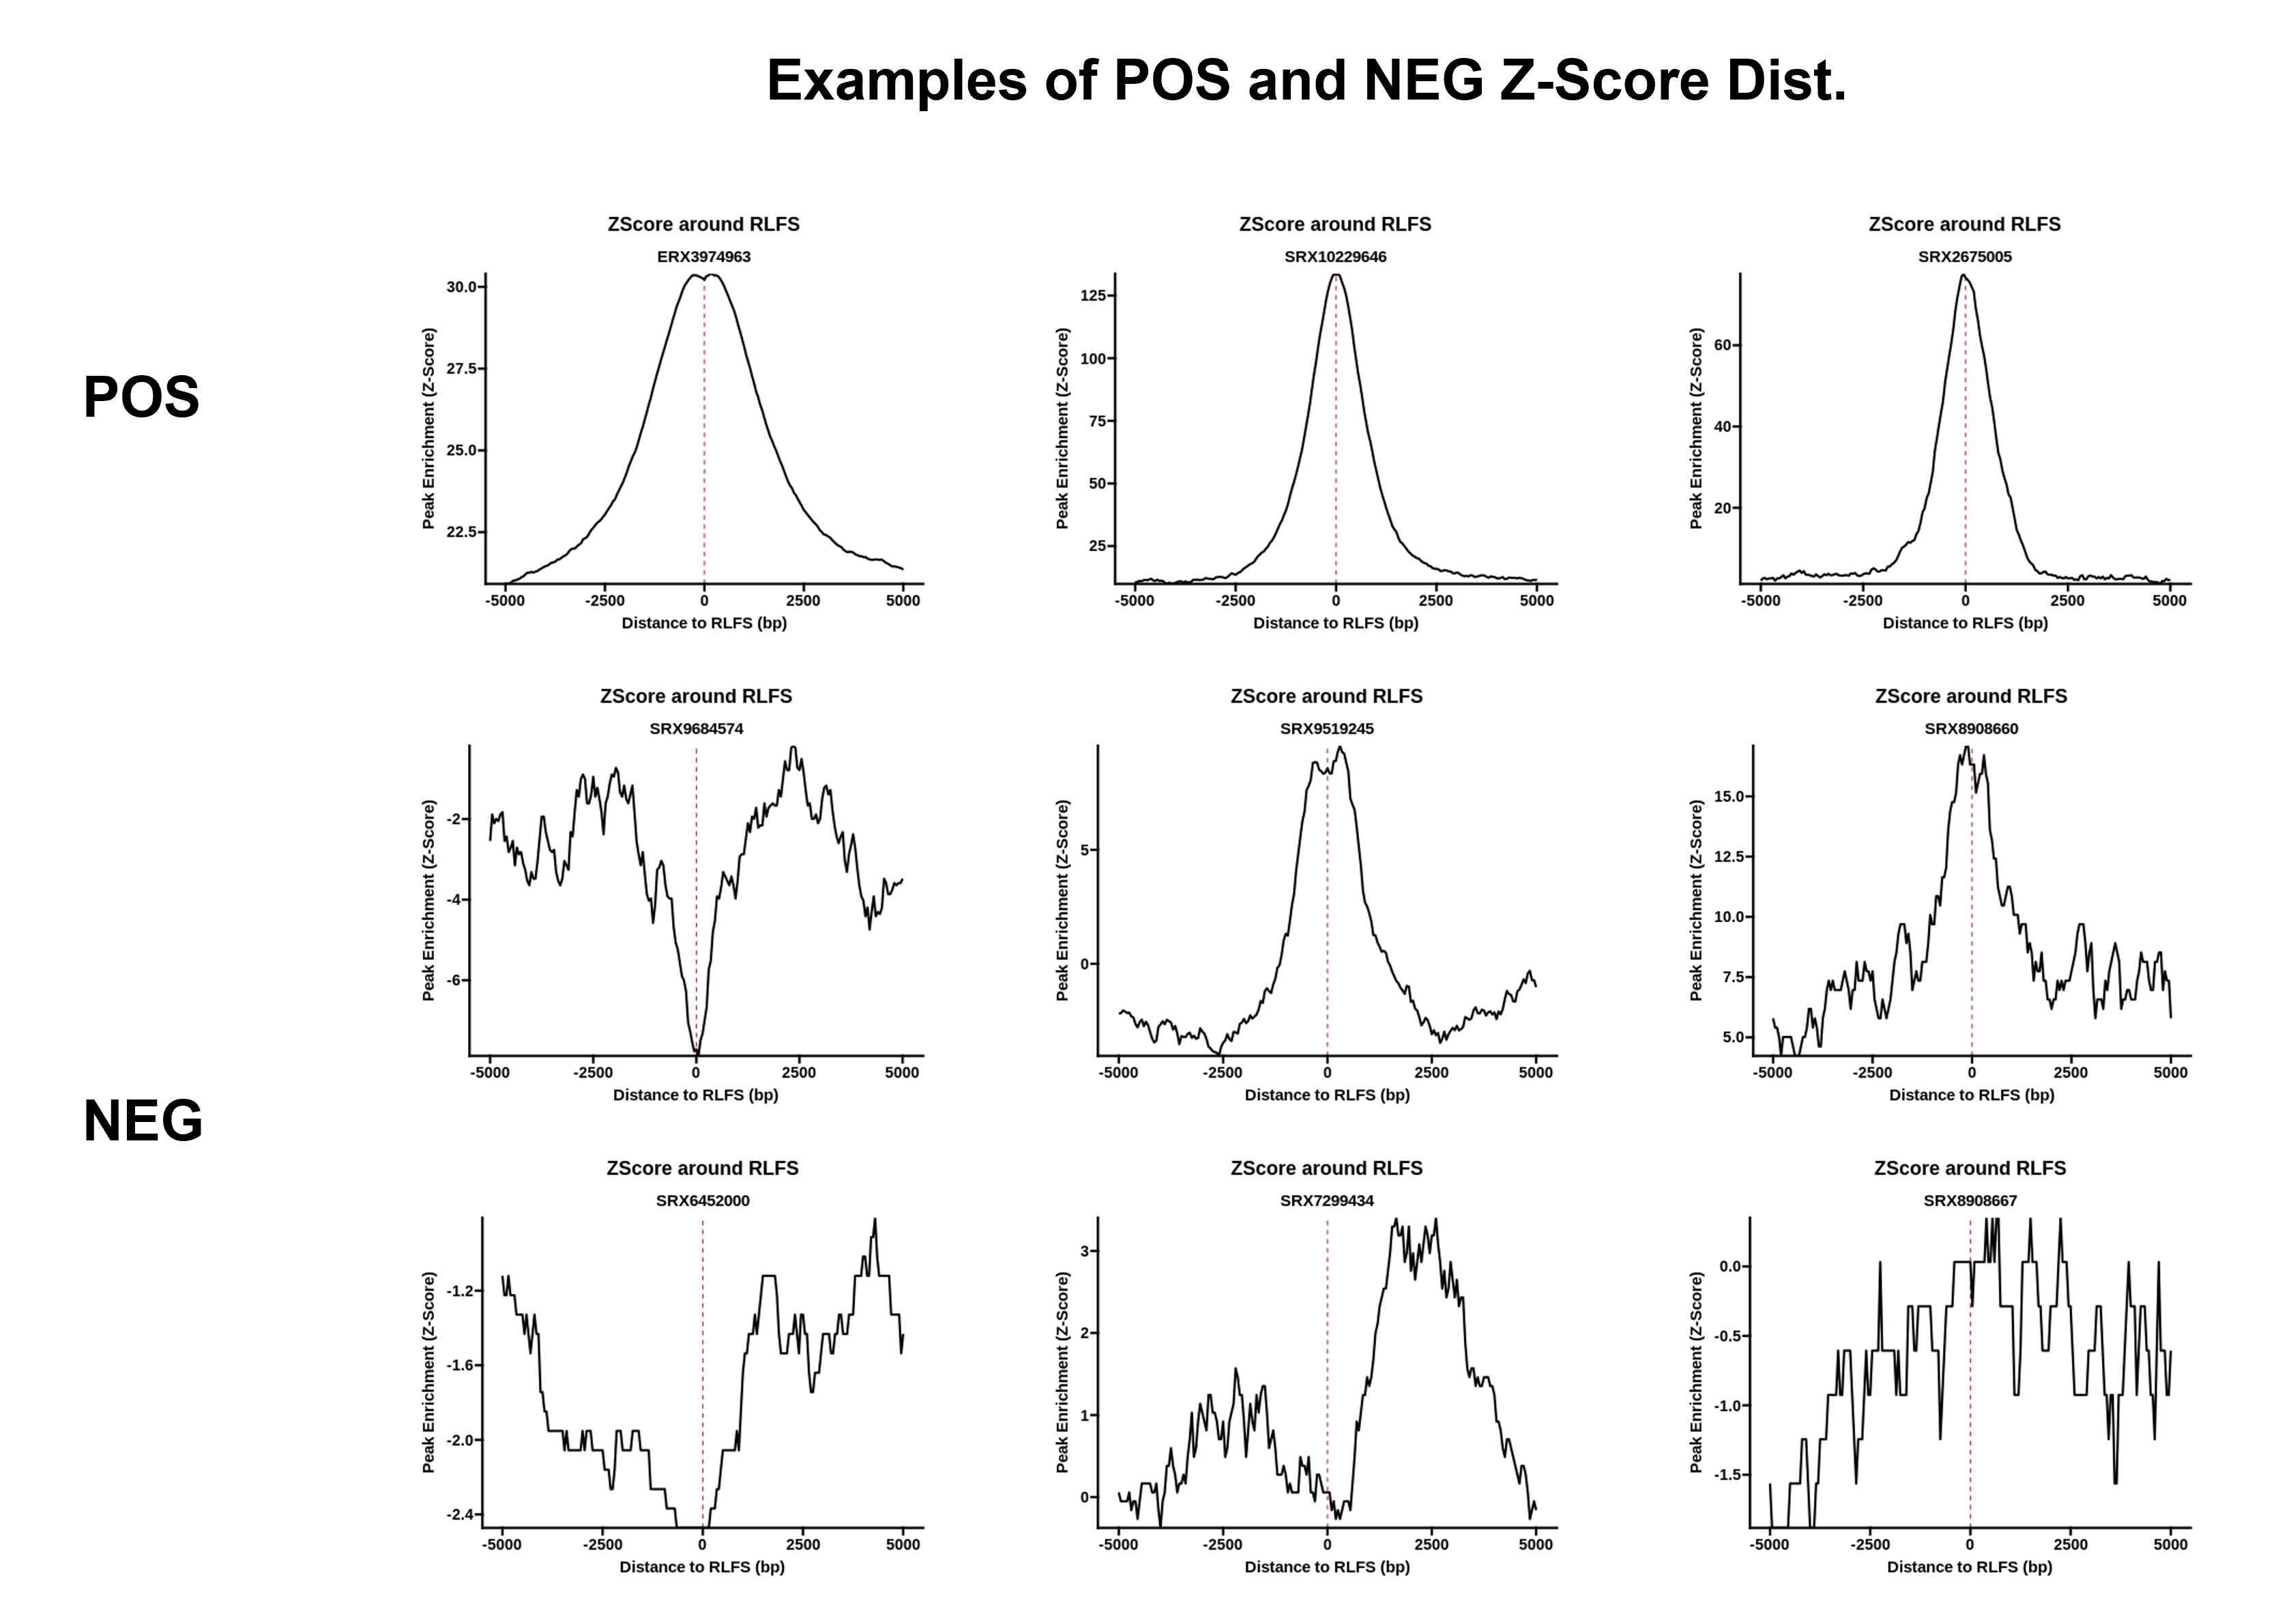
Z-Score distribution
R-loop forming sequences (RLFS) were compared to the ranges in r object@metadata$sampleName to measure enrichment. The resulting Z-score distribution is visualized below:
plotRLFSRes(object)
Note: for samples which map R-loop successfully, enrichment is expected. See representative examples for POS and NEG sample types here{target="_blank"}.
Details
Additional details
RLFS were derived across the genome using QmRLFS-finder.py{target="_blank"}. R-loop broad peaks were called with macs and then compared with RLFS using permTest from the regioneR{target="_blank"} R package. An empirical distribution of RLFS was generated using the circularRandomizeRegions method and compared to the peaks in order to calculate enrichment p value and zscore (effect size of enrichment). For additional detail, please refer to the RLSeq::analyzeRLFS documentation (link{target="_blank"}).
# Wrangle data
rlfs_data <- rlresult(object, resultName = "rlfsRes")
pt <- rlfs_data$perTestResults
pval <- pt[[1]]$pval
ntimes <- pt[[1]]$ntimes
zscore <- pt[[1]]$zscore
lz <- rlfs_data$`Z-scores`

# Set display colors
rlfs_pval_color <- ifelse(pval > .05, 'red', ifelse(pval > .01, 'orange', 'green'))
rlfs_zs_color <- ifelse(zscore < 5, 'red', ifelse(zscore < 15, 'orange', 'green'))
From this analysis, the empirically-determined p value was r pval (with r ntimes permutations, the minimum possible p value was r 1/(1 + ntimes)).
The enrichment z-score was r zscore.
plot(pt)
Bishop-Laboratory/RLSeq documentation built on Jan. 28, 2023, 11:38 p.m.
R Package Documentation
Browse R Packages
We want your feedback!
Note that we can't provide technical support on individual packages. You should contact the package authors for that.
r i. r names(resAnchor) {#r resAnchor}
Z-Score distribution
R-loop forming sequences (RLFS) were compared to the ranges in r object@metadata$sampleName to measure enrichment. The resulting Z-score distribution is visualized below:
plotRLFSRes(object)
Note: for samples which map R-loop successfully, enrichment is expected. See representative examples for POS and NEG sample types here{target="_blank"}.
Details
Additional details
RLFS were derived across the genome using QmRLFS-finder.py{target="_blank"}. R-loop broad peaks were called with macs and then compared with RLFS using permTest from the regioneR{target="_blank"} R package. An empirical distribution of RLFS was generated using the circularRandomizeRegions method and compared to the peaks in order to calculate enrichment p value and zscore (effect size of enrichment). For additional detail, please refer to the RLSeq::analyzeRLFS documentation (link{target="_blank"}).
# Wrangle data rlfs_data <- rlresult(object, resultName = "rlfsRes") pt <- rlfs_data$perTestResults pval <- pt[[1]]$pval ntimes <- pt[[1]]$ntimes zscore <- pt[[1]]$zscore lz <- rlfs_data$`Z-scores` # Set display colors rlfs_pval_color <- ifelse(pval > .05, 'red', ifelse(pval > .01, 'orange', 'green')) rlfs_zs_color <- ifelse(zscore < 5, 'red', ifelse(zscore < 15, 'orange', 'green'))
From this analysis, the empirically-determined p value was r pval (with r ntimes permutations, the minimum possible p value was r 1/(1 + ntimes)).
The enrichment z-score was r zscore.
plot(pt)
R Package Documentation
Browse R Packages
We want your feedback!
Note that we can't provide technical support on individual packages. You should contact the package authors for that.
Embedding an R snippet on your website
Add the following code to your website.
For more information on customizing the embed code, read Embedding Snippets.