README.md
In Yin1012/BreakViz: R Package Template
BreakViz
Overview
The goal of BreakViz is to detect possible breakpoints' location in human whole genome sequencing data from MinION and visualize them with by using heatmap.
After sequencing and mapping, human DNA will be transformed into a bed file.The bed format file will be used as import in my package. User must provides two filters about selecting breakpoints : MinOverlap, Maxdistance. We will select possible breakpoints based on these two parameters and create a heat table for whole reads. The package will add heat to reads based on their status after filtering. After visulization, a heatmap version of chromosomes will be showed.
Dependencies
chromoMap, shiny
Installation
You can install BreakViz from github with:
devtools::install_github("Yin1012/BreakViz")
Example pipeline
This is a basic example which shows you how to solve a common problem:
#prepare work
library(devtools)
BiocManager::install("rtracklayer")
library(rtracklayer)
devtools::load_all(".")

#import bedfile
bedFile <- import(system.file("extdata", "test_file_4.bed", package = "BreakViz"), format = "bed")

#visualize the possible pairs
visPossiblePair(bedFile, minOverlap = 100, maxDistance = 1000, baseCol = 1)

#run shiny app
runApp('R/BreakVizApp.R')
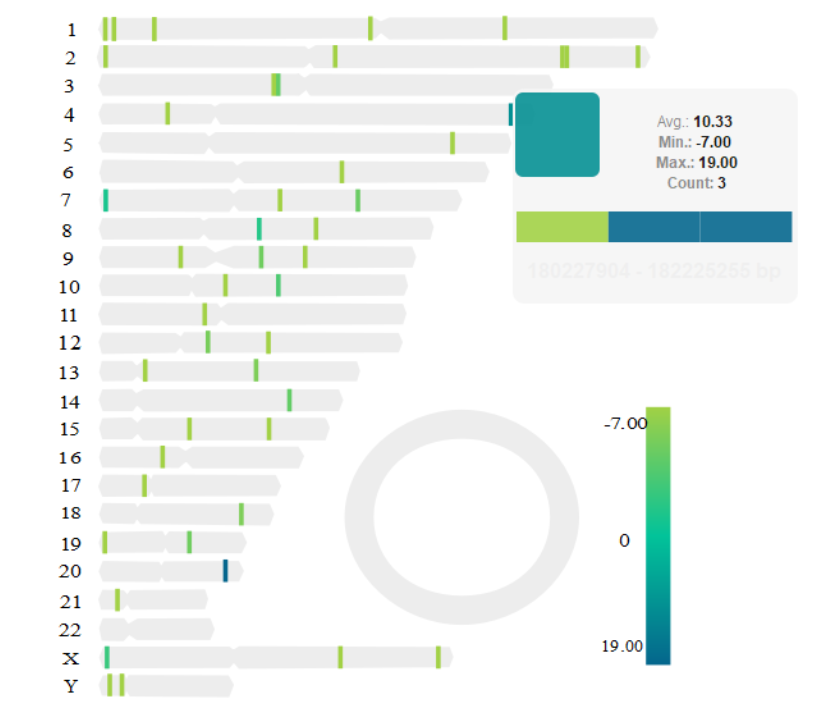
Sample output
Yin1012/BreakViz documentation built on May 14, 2019, 4:01 a.m.
R Package Documentation
Browse R Packages
We want your feedback!
Note that we can't provide technical support on individual packages. You should contact the package authors for that.
BreakViz
Overview
The goal of BreakViz is to detect possible breakpoints' location in human whole genome sequencing data from MinION and visualize them with by using heatmap.
After sequencing and mapping, human DNA will be transformed into a bed file.The bed format file will be used as import in my package. User must provides two filters about selecting breakpoints : MinOverlap, Maxdistance. We will select possible breakpoints based on these two parameters and create a heat table for whole reads. The package will add heat to reads based on their status after filtering. After visulization, a heatmap version of chromosomes will be showed.
Dependencies
chromoMap, shiny
Installation
You can install BreakViz from github with:
devtools::install_github("Yin1012/BreakViz")
Example pipeline
This is a basic example which shows you how to solve a common problem:
#prepare work
library(devtools)
BiocManager::install("rtracklayer")
library(rtracklayer)
devtools::load_all(".")
#import bedfile
bedFile <- import(system.file("extdata", "test_file_4.bed", package = "BreakViz"), format = "bed")
#visualize the possible pairs
visPossiblePair(bedFile, minOverlap = 100, maxDistance = 1000, baseCol = 1)
#run shiny app
runApp('R/BreakVizApp.R')
Sample output
R Package Documentation
Browse R Packages
We want your feedback!
Note that we can't provide technical support on individual packages. You should contact the package authors for that.
Embedding an R snippet on your website
Add the following code to your website.
For more information on customizing the embed code, read Embedding Snippets.