In compbiomed/animalcules: Interactive microbiome analysis toolkit
knitr::opts_chunk$set(echo = TRUE)
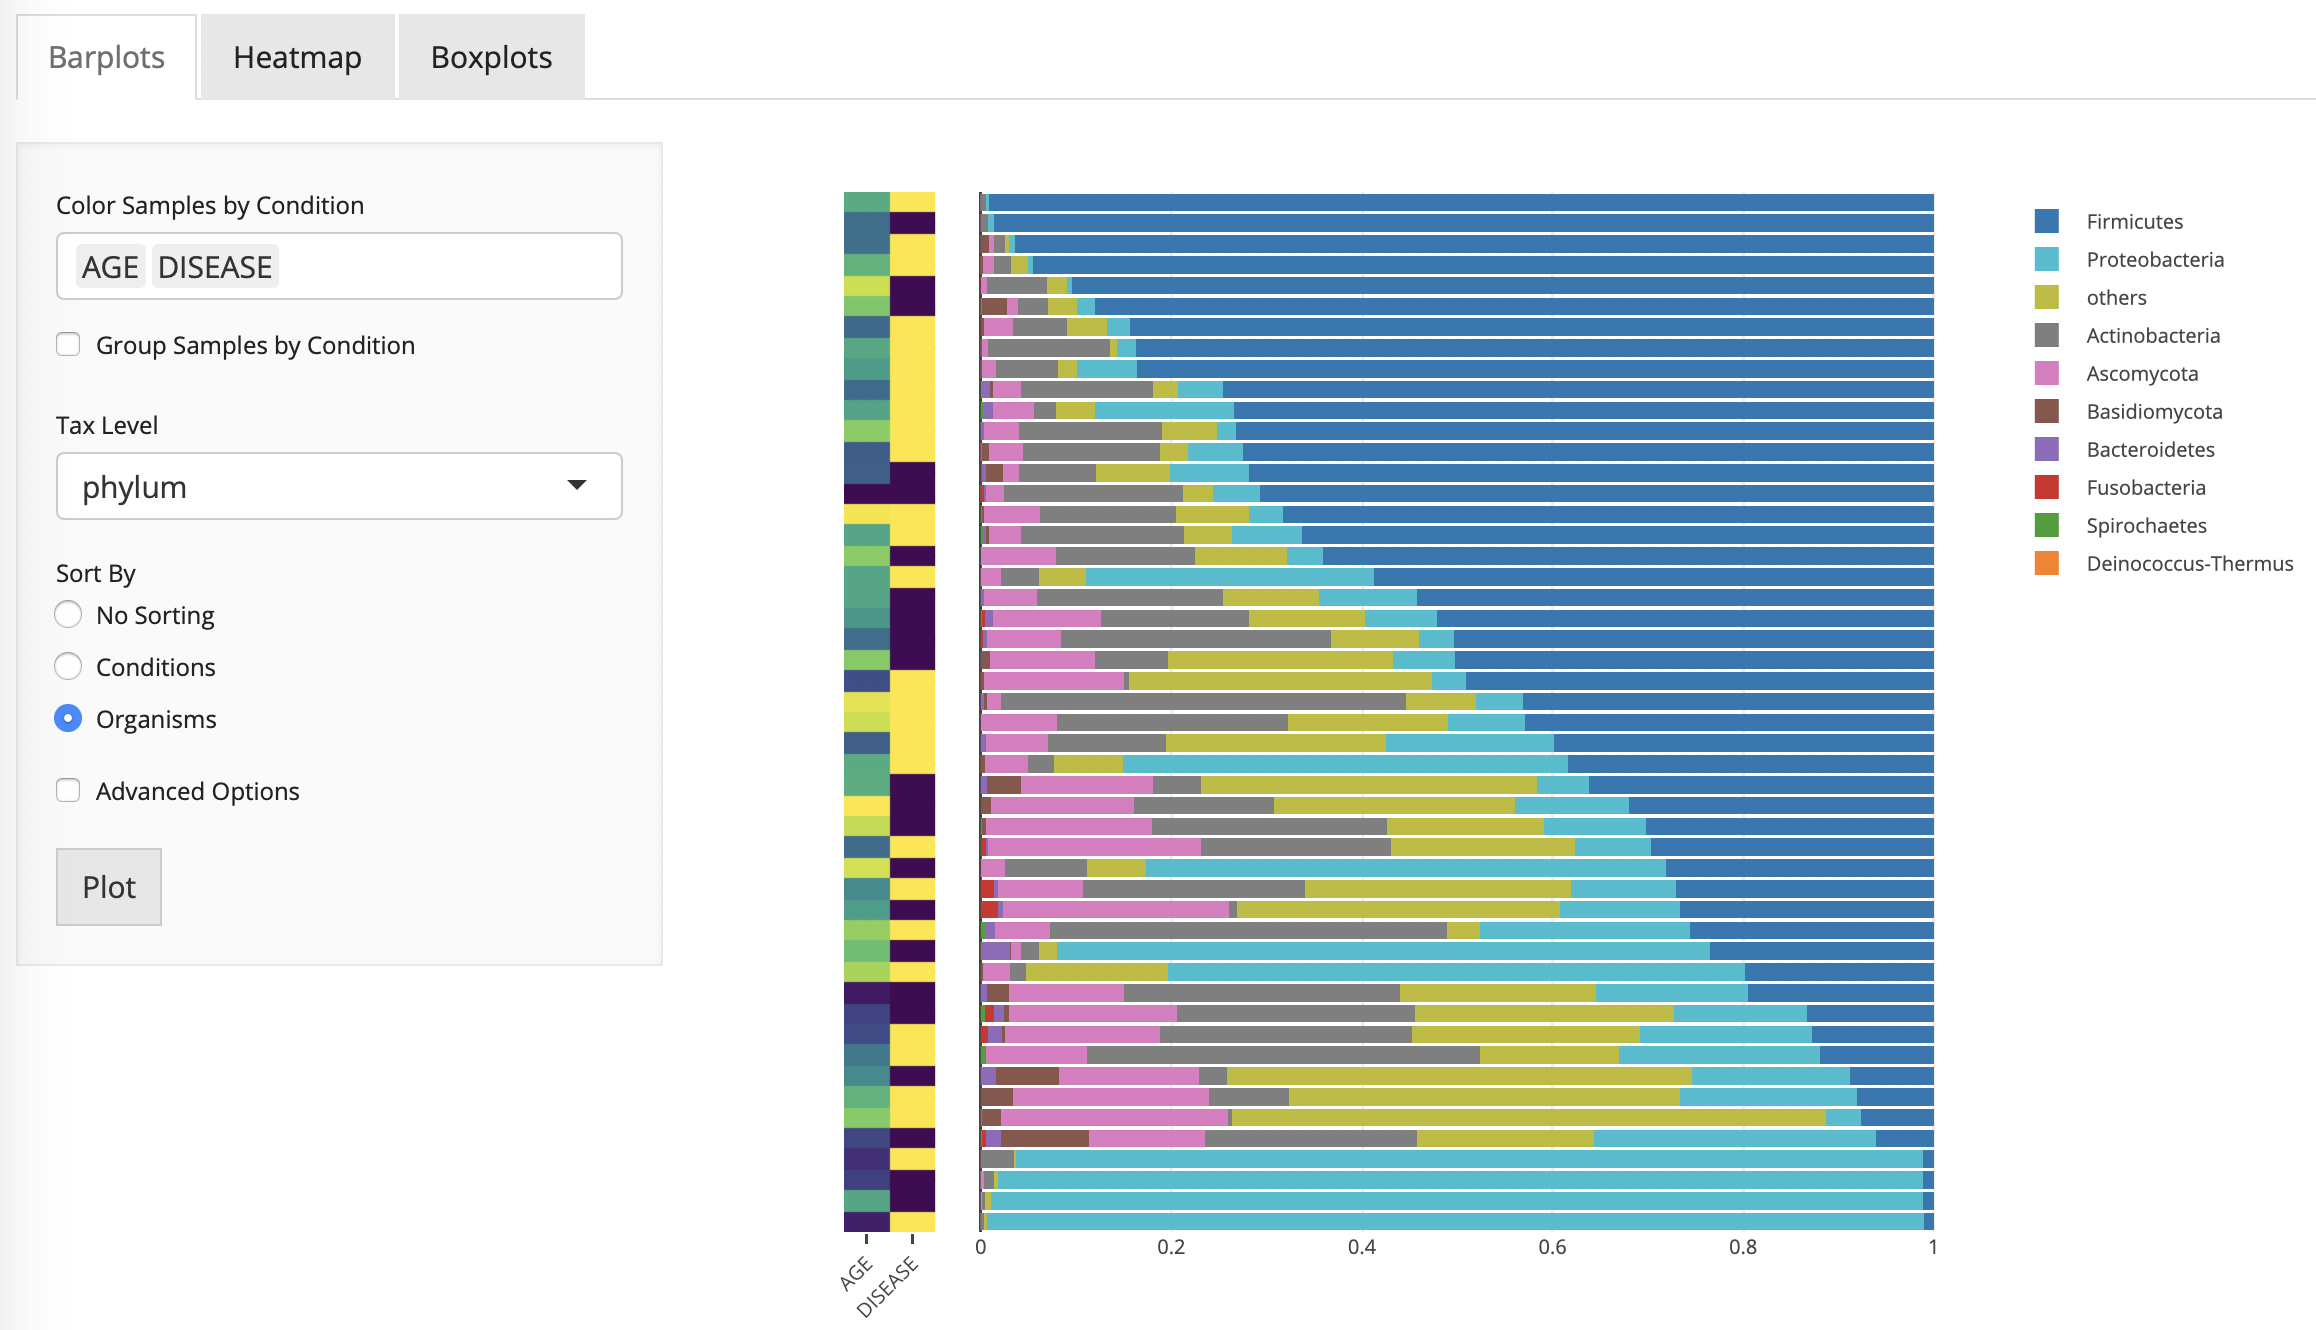
Relative Abundance Stacked Bar Plot
The stacked bar plots are used to visualize the relative abundance of microbes at a given taxonomical level in each sample represented as a single bar.
Instructions:
- Select taxonomy level in the menu (default is genus)
- (Optional) Add a color bar for one of more sample conditions
- (Optional) Group samples and aggregate abundances by a condition
- (Optional) Sort samples by conditions or the presence of specific organisms
- (Optional) Select "Advanced Options" to view:
- (Optional) Isolate or discard samples
- (Optional) Order organisms
- (Optional) Hide or show legend (default is to show legend)
- (Optional) Adjust plot height
- (Optional) Adjust plot width
- Click the button "Plot"
Relative Abundance Heatmap
The heatmap represents a sample by organisms matrix that can be visualized at different taxonomic levels.
Instructions:
- Select taxonomy level in the menu (default is genus)
- (Optional) Add a color bar for one of more sample conditions
- (Optional) Sort samples by conditions or the presence of specific organisms
- (Optional) Select "Advanced Options"
- (Optional) Isolate organisms or samples
- (Optional) Discard samples
- (Optional) Use raw counts or log(CPM) (default is log(CPM))
- (Optional) Adjust plot height
- (Optional) Adjust plot width
- Click the button "Plot"

Relative Abundance Boxplot
The boxplot visualization allows users to compare the abundance of one or more organisms at multiple taxonomical levels between categorical attributes.
Instructions:
- Select one or more taxonomy levels in the menu (default is genus)
- For each taxonomy level select one or more organisms to compare
- (Optional) Separate plots when viewing multiple organisms on the same taxonomy level
- Select a condition to compare organisms across
- Select a datatype to use
- (Optional) Select "Advanced Options"
- (Optional) Select a custom plot height
- (Optional) Select a custom plot width
- Click the button "Plot"

compbiomed/animalcules documentation built on Feb. 7, 2024, 12:13 p.m.
R Package Documentation
Browse R Packages
We want your feedback!
Note that we can't provide technical support on individual packages. You should contact the package authors for that.
knitr::opts_chunk$set(echo = TRUE)
Relative Abundance Stacked Bar Plot
The stacked bar plots are used to visualize the relative abundance of microbes at a given taxonomical level in each sample represented as a single bar.
Instructions:
- Select taxonomy level in the menu (default is genus)
- (Optional) Add a color bar for one of more sample conditions
- (Optional) Group samples and aggregate abundances by a condition
- (Optional) Sort samples by conditions or the presence of specific organisms
- (Optional) Select "Advanced Options" to view:
- (Optional) Isolate or discard samples
- (Optional) Order organisms
- (Optional) Hide or show legend (default is to show legend)
- (Optional) Adjust plot height
- (Optional) Adjust plot width
- Click the button "Plot"
Relative Abundance Heatmap
The heatmap represents a sample by organisms matrix that can be visualized at different taxonomic levels.
Instructions:
- Select taxonomy level in the menu (default is genus)
- (Optional) Add a color bar for one of more sample conditions
- (Optional) Sort samples by conditions or the presence of specific organisms
- (Optional) Select "Advanced Options"
- (Optional) Isolate organisms or samples
- (Optional) Discard samples
- (Optional) Use raw counts or log(CPM) (default is log(CPM))
- (Optional) Adjust plot height
- (Optional) Adjust plot width
- Click the button "Plot"
Relative Abundance Boxplot
The boxplot visualization allows users to compare the abundance of one or more organisms at multiple taxonomical levels between categorical attributes.
Instructions:
- Select one or more taxonomy levels in the menu (default is genus)
- For each taxonomy level select one or more organisms to compare
- (Optional) Separate plots when viewing multiple organisms on the same taxonomy level
- Select a condition to compare organisms across
- Select a datatype to use
- (Optional) Select "Advanced Options"
- (Optional) Select a custom plot height
- (Optional) Select a custom plot width
- Click the button "Plot"
R Package Documentation
Browse R Packages
We want your feedback!
Note that we can't provide technical support on individual packages. You should contact the package authors for that.
Embedding an R snippet on your website
Add the following code to your website.
For more information on customizing the embed code, read Embedding Snippets.