In compbiomed/animalcules: Interactive microbiome analysis toolkit
Alpha Diversity
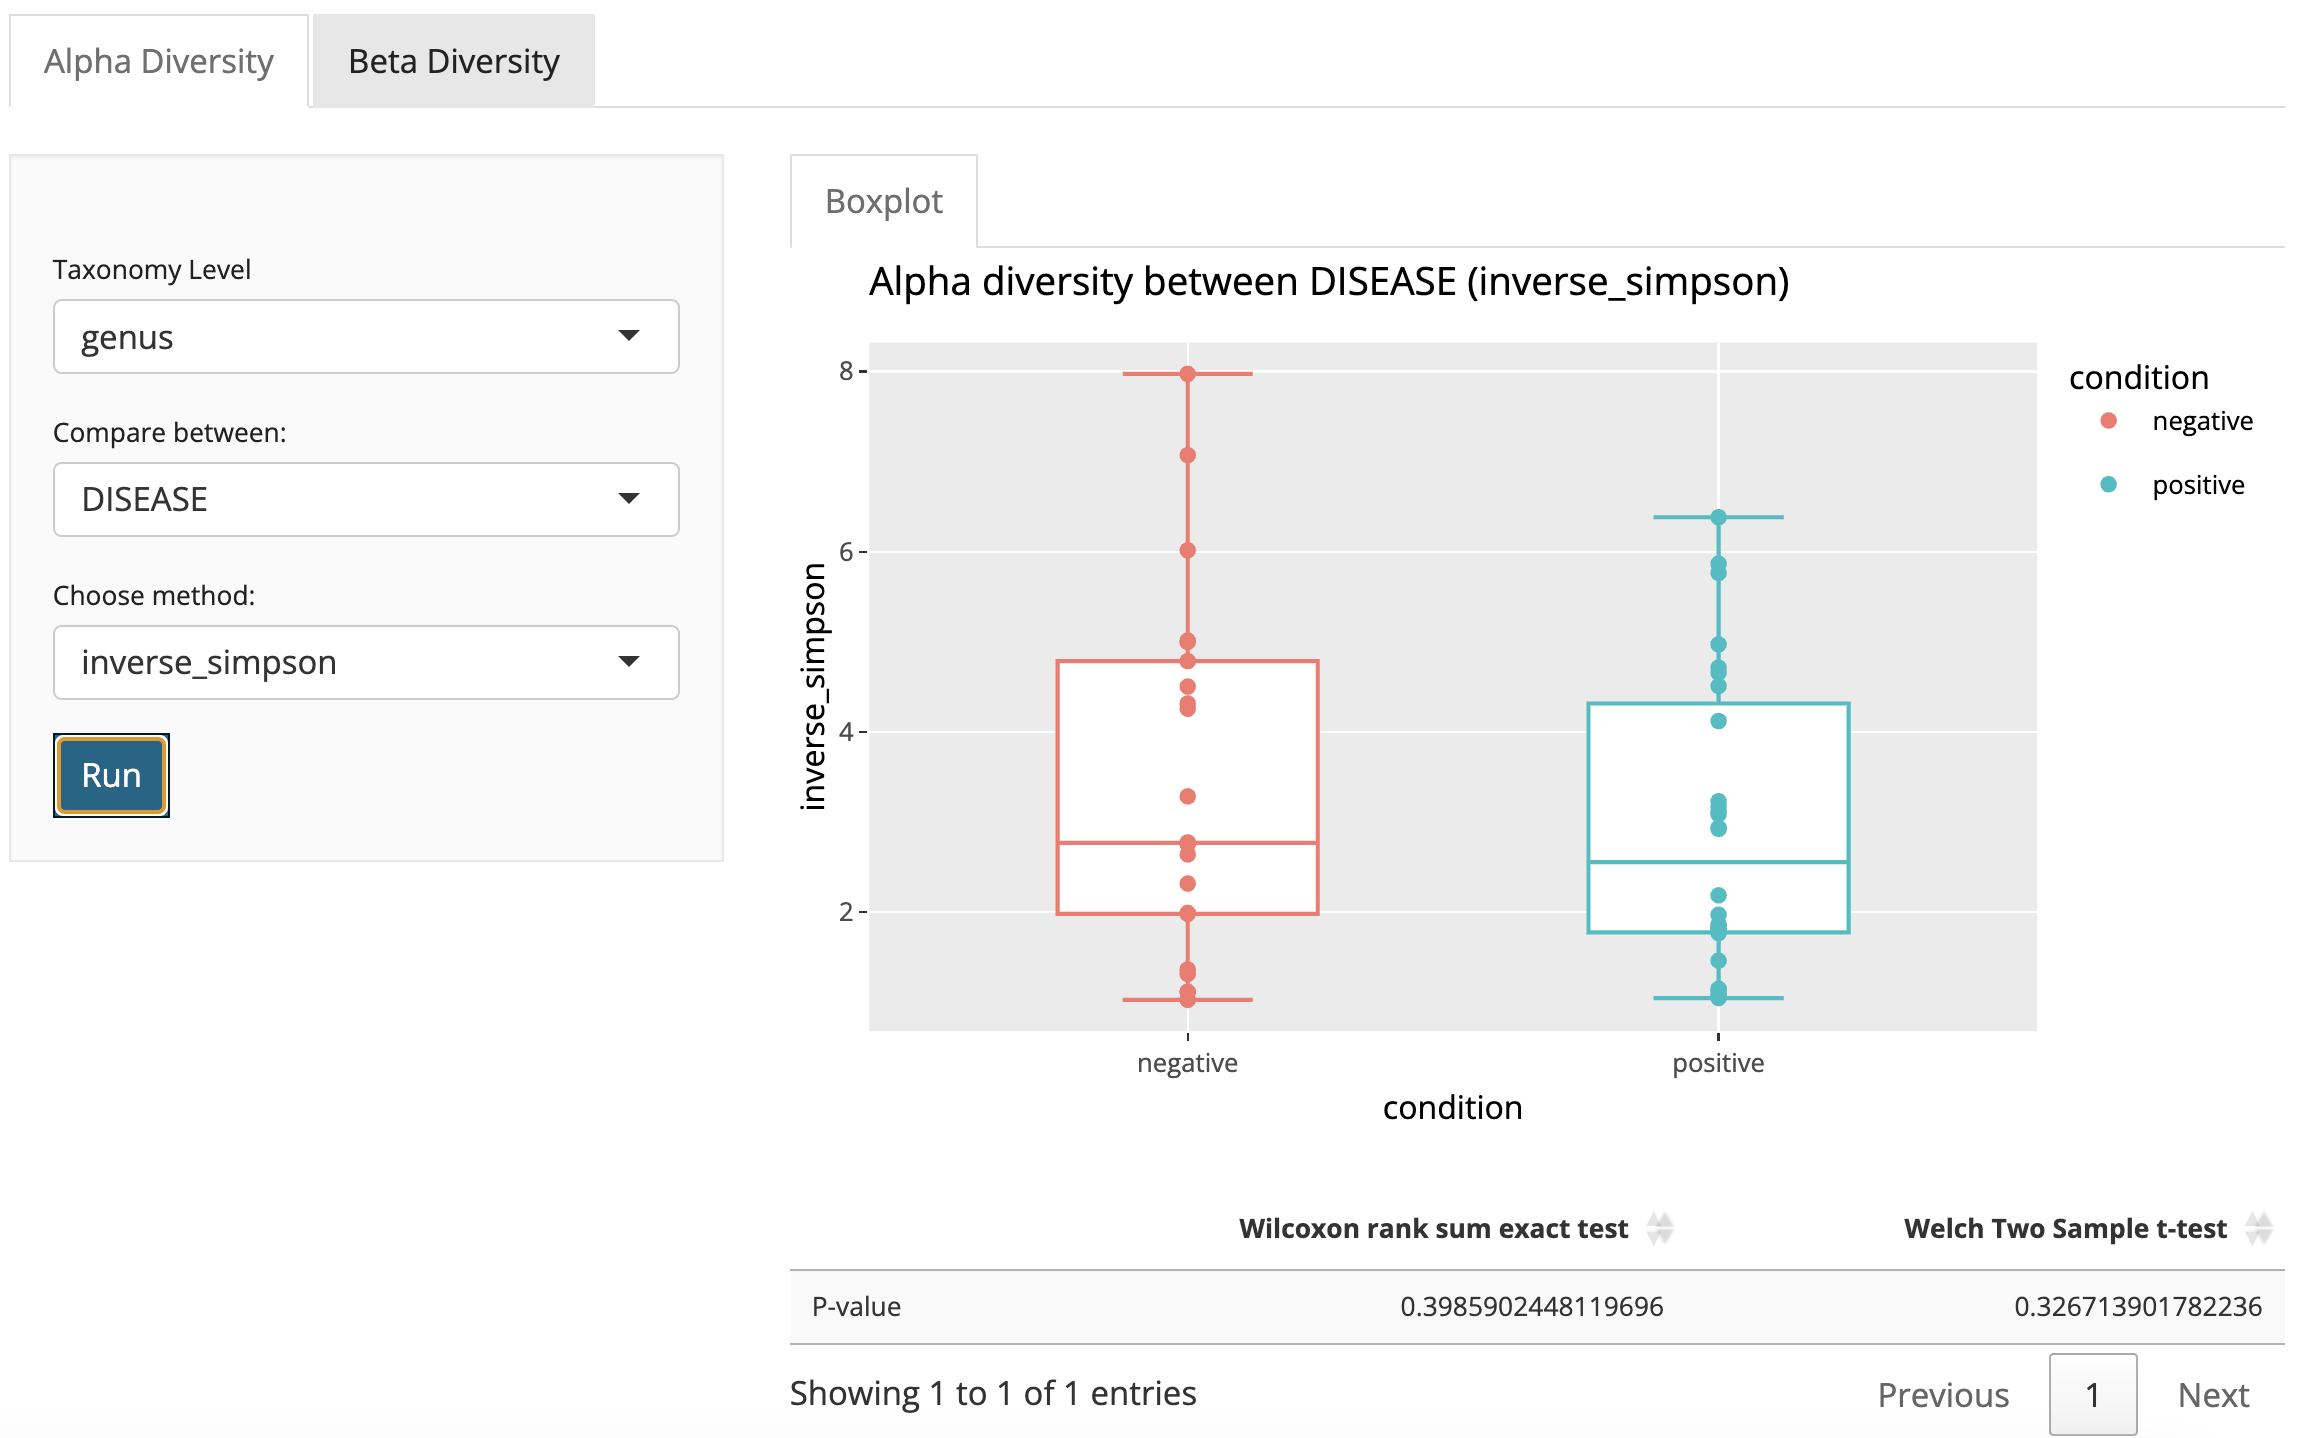
Users can visualize alpha diversity with a boxplot comparing different levels within a selected condition by selecting taxonomy levels and target condition. Users can also choose different alpha diversity metrics including Shannon, Inverse Simpson and Gini Simpson.
The statistical test will be performed between levels in the selected target condition. Appropriate statistical test methods will be applied automatically, which may include T-test, Kruskal-Wallis rank sum test, or Wilcoxon rank sum test. Test p-values will be shown in the result table.
Instructions:
- Select taxonomy level in the menu (default is genus).
- Select the target variable for alpha diversity comparison.
- (Optional) Select alpha diversity metrics (default is Inverse Simpson).
- Click the button "Run"
Running time: < 1s
Beta Diversity Heatmap
Users can visualize the beta diversity with a heatmap by selecting the "Beta Diversity" tab within "Diversity" tab. Users should select the taxonomy level they wish to view, as well as the beta diversity metric of interest (including Bray-curtis or Jaccard), and which sample conditions they wish the heatmap to display. Samples can also be sorted by the selected condition.
Instructions:
- Select taxonomy level in the menu (default is genus).
- Select beta diversity metrics (default is bray-curtis).
- Select the target variable(s) for beta diversity comparison.
- Select if samples will be sorted by the selected variable (default: no sorting).
- Click the button "Plot Heatmap"
Running time: < 1s

Beta Diversity Statistical Test
To check if there is significant beta diversity difference existing between two communities, users can also perform statistical test like PERMANOVA test, Kruskal-Wallis rank sum test, and Wilcoxon rank sum test. Note that the left panel options apply to both beta diversity heatmap and statistical test. Test p-value will be showed in the "Pr(>F)" column from the result table.
Instructions:
- Click the "Boxplot" tab in the right panel next to the "Heatmap" tab.
- Select the taxonomy level and distance metric in the left panel.
- Select the test type (default is PERMANOVA).
- Select the target variable.
- (Optional) Select the number of permutations if doing PERMANOVA (default is 999).
- Click the button "Run"

Beta Diversity NMDS Plot
Users may wish to display beta diversity information in an NMDS plot. This can be accomplished using the NMDS tab.
Instructions:
- Click the tab "NMDS" in the right panel next to the tab "Boxplot"
- Select taxonomy level in the left panel menu (default is genus).
- Select beta diversity metrics in the left panel menu (default is bray-curtis).
- Select the target variable/condition
- Click the button "Plot NMDS"

compbiomed/animalcules documentation built on Feb. 7, 2024, 12:13 p.m.
R Package Documentation
Browse R Packages
We want your feedback!
Note that we can't provide technical support on individual packages. You should contact the package authors for that.
Alpha Diversity
Users can visualize alpha diversity with a boxplot comparing different levels within a selected condition by selecting taxonomy levels and target condition. Users can also choose different alpha diversity metrics including Shannon, Inverse Simpson and Gini Simpson.
The statistical test will be performed between levels in the selected target condition. Appropriate statistical test methods will be applied automatically, which may include T-test, Kruskal-Wallis rank sum test, or Wilcoxon rank sum test. Test p-values will be shown in the result table.
Instructions:
- Select taxonomy level in the menu (default is genus).
- Select the target variable for alpha diversity comparison.
- (Optional) Select alpha diversity metrics (default is Inverse Simpson).
- Click the button "Run"
Running time: < 1s
Beta Diversity Heatmap
Users can visualize the beta diversity with a heatmap by selecting the "Beta Diversity" tab within "Diversity" tab. Users should select the taxonomy level they wish to view, as well as the beta diversity metric of interest (including Bray-curtis or Jaccard), and which sample conditions they wish the heatmap to display. Samples can also be sorted by the selected condition.
Instructions:
- Select taxonomy level in the menu (default is genus).
- Select beta diversity metrics (default is bray-curtis).
- Select the target variable(s) for beta diversity comparison.
- Select if samples will be sorted by the selected variable (default: no sorting).
- Click the button "Plot Heatmap"
Running time: < 1s
Beta Diversity Statistical Test
To check if there is significant beta diversity difference existing between two communities, users can also perform statistical test like PERMANOVA test, Kruskal-Wallis rank sum test, and Wilcoxon rank sum test. Note that the left panel options apply to both beta diversity heatmap and statistical test. Test p-value will be showed in the "Pr(>F)" column from the result table.
Instructions:
- Click the "Boxplot" tab in the right panel next to the "Heatmap" tab.
- Select the taxonomy level and distance metric in the left panel.
- Select the test type (default is PERMANOVA).
- Select the target variable.
- (Optional) Select the number of permutations if doing PERMANOVA (default is 999).
- Click the button "Run"
Beta Diversity NMDS Plot
Users may wish to display beta diversity information in an NMDS plot. This can be accomplished using the NMDS tab.
Instructions:
- Click the tab "NMDS" in the right panel next to the tab "Boxplot"
- Select taxonomy level in the left panel menu (default is genus).
- Select beta diversity metrics in the left panel menu (default is bray-curtis).
- Select the target variable/condition
- Click the button "Plot NMDS"
R Package Documentation
Browse R Packages
We want your feedback!
Note that we can't provide technical support on individual packages. You should contact the package authors for that.
Embedding an R snippet on your website
Add the following code to your website.
For more information on customizing the embed code, read Embedding Snippets.