In montilab/K2Taxonomer: Creating annotated submodules of high-throughput data through recursive partitioning
knitr::opts_chunk$set(
    collapse=TRUE,
    comment="#>",
    message=FALSE,
    warning=FALSE
)
Introduction
To facilitate the comprehensive interrogation the output of
r Githubpkg("montilab/K2Taxonomer") this package includes functionality for
generating interactive dashboards, which include full compendia of results
[@reed_2020]. In addition to the partition-level molecular comparisons included
in these dashboards, they include functionality for performing molecular
comparisons of gene expression and gene set enrichment on user-specified sets
of two-or-more subgroups. Here we describe the layout and usage of these
dashboards.
For more information for how to generate these dashboards go
here.
The r Githubpkg("montilab/K2Taxonomer") dashboards include three tabs,
described below:
-
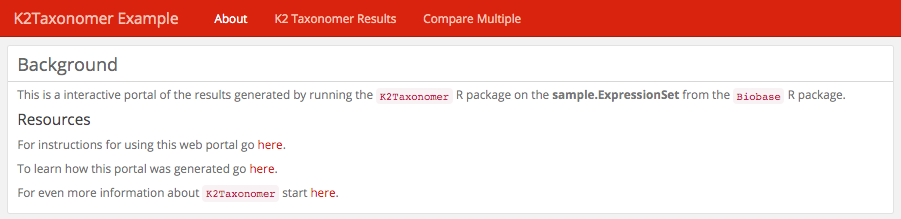
About: This is an optional tab with which the user can include
information about the analysis being performed. This page is populated by a
file, "about.md", included in the same directory as the dashboard file.
More information about formatting this file can be found
here.
-
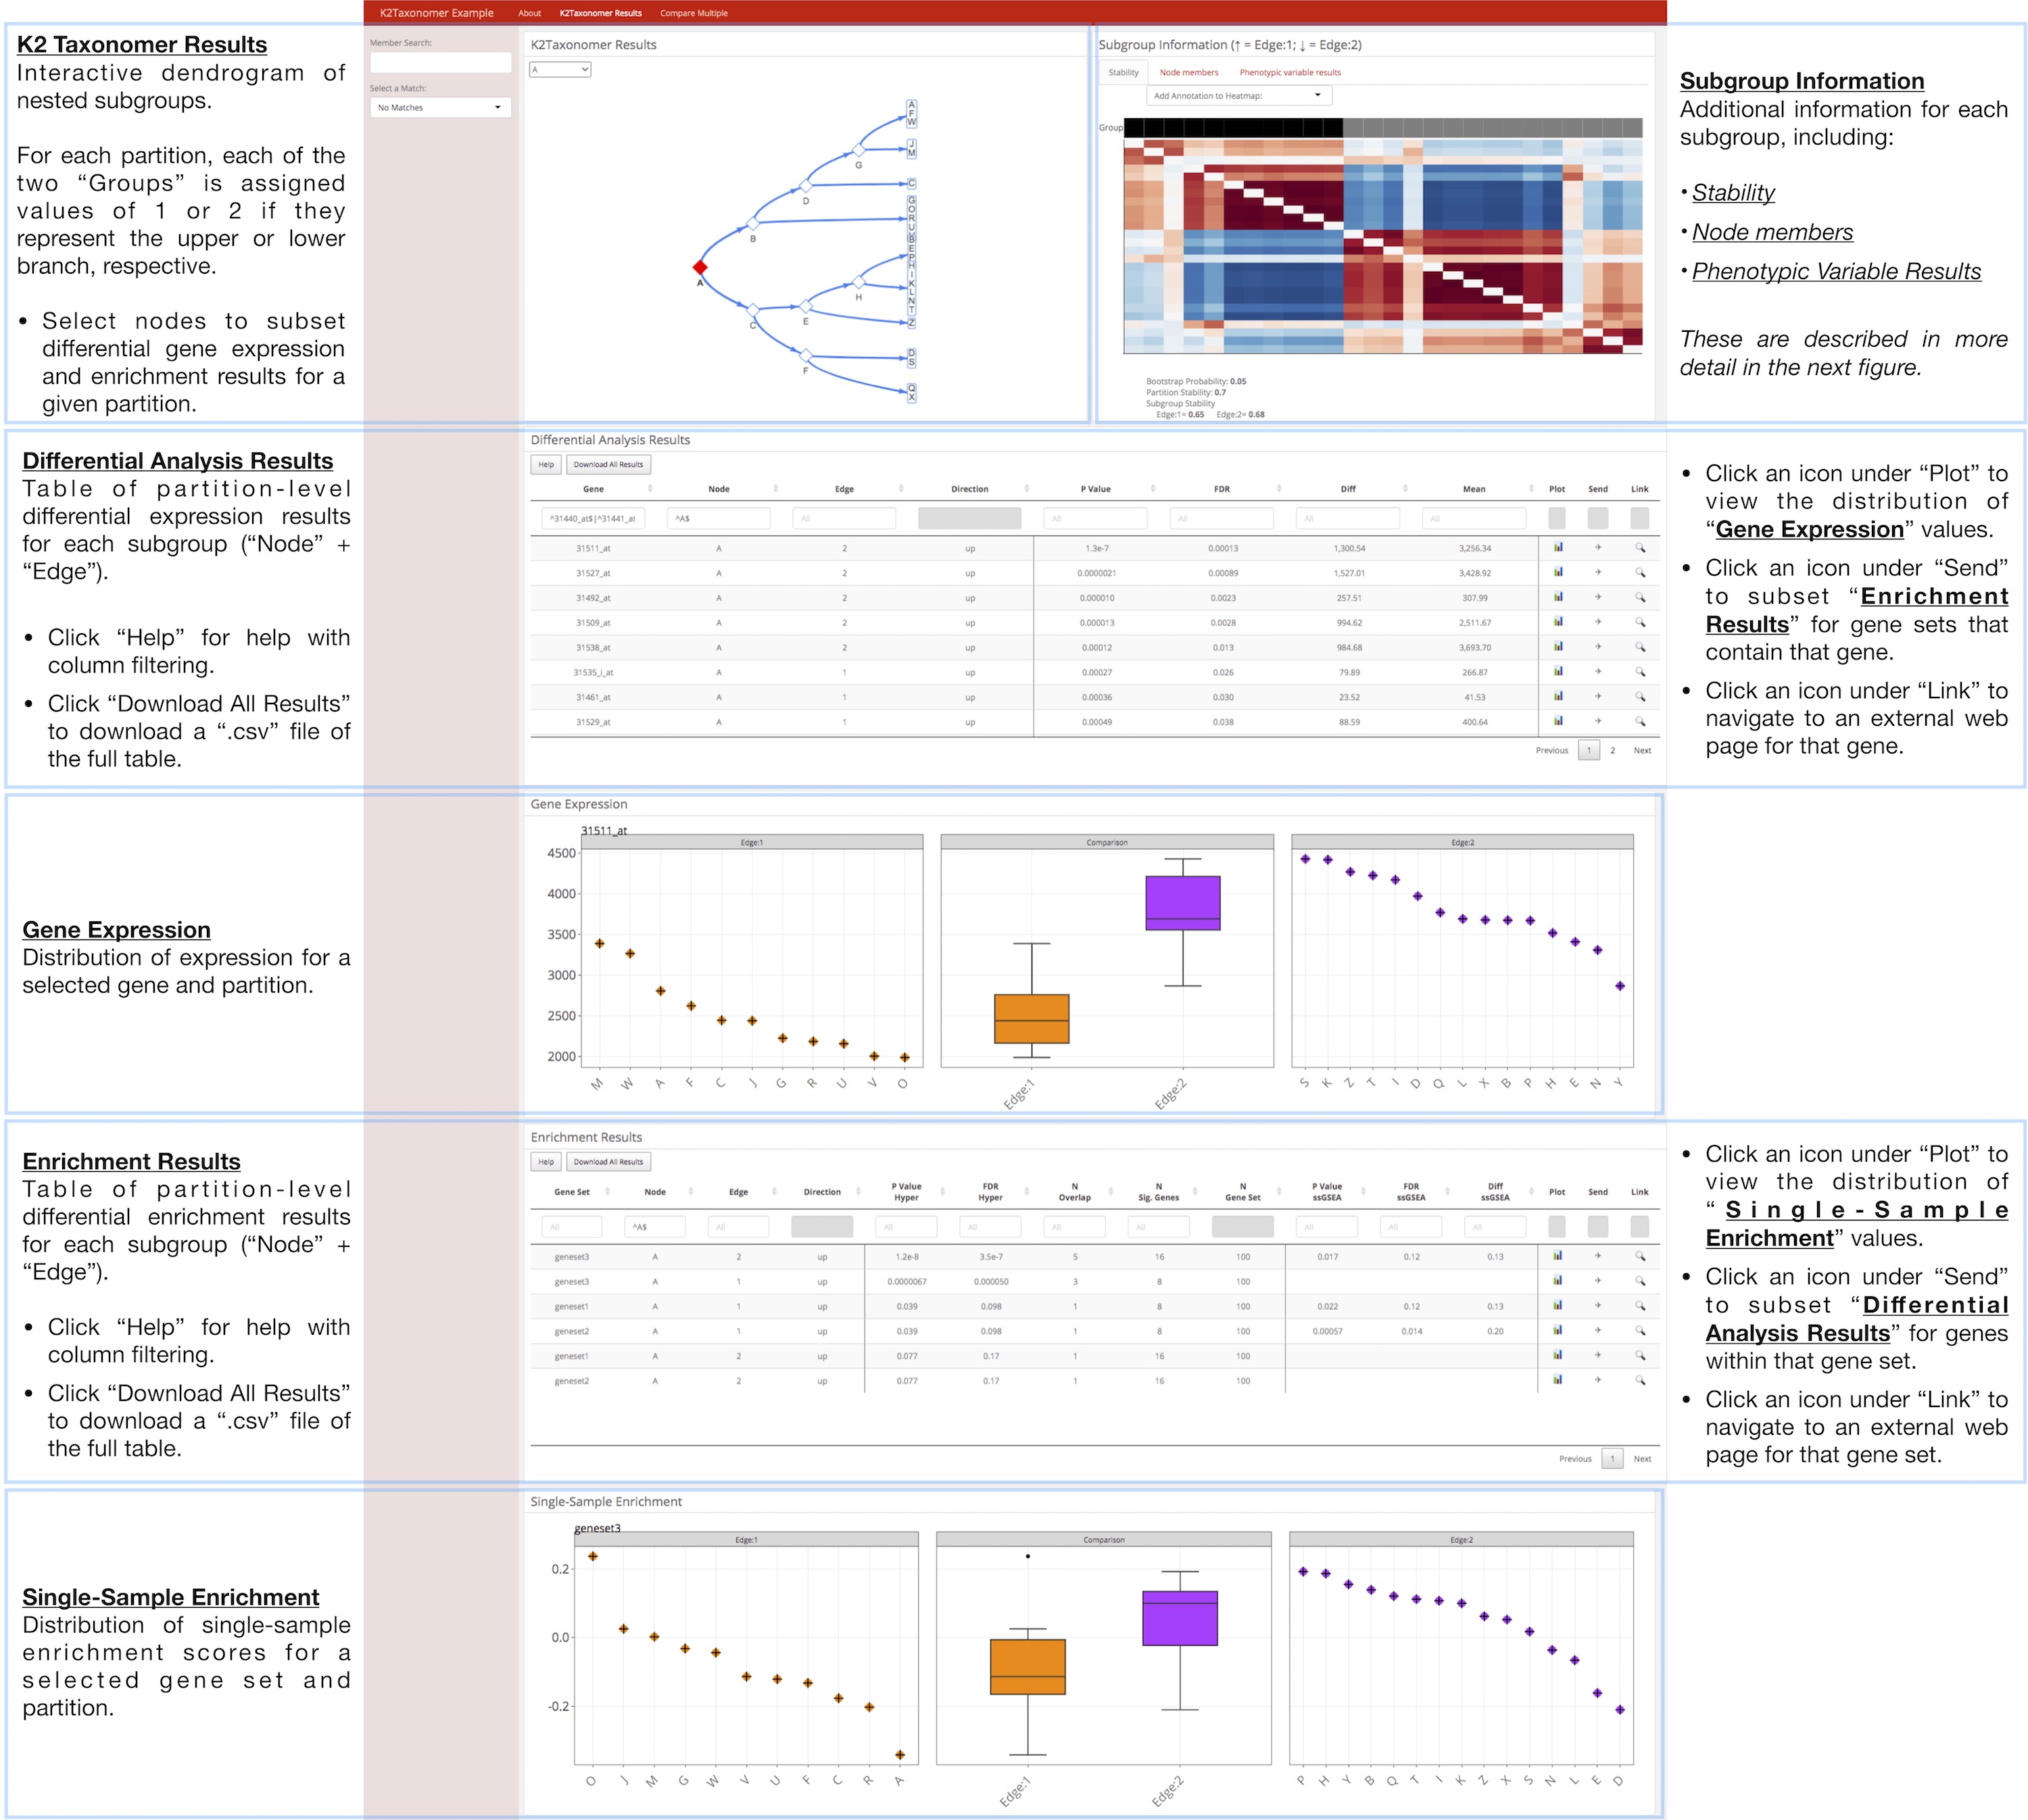
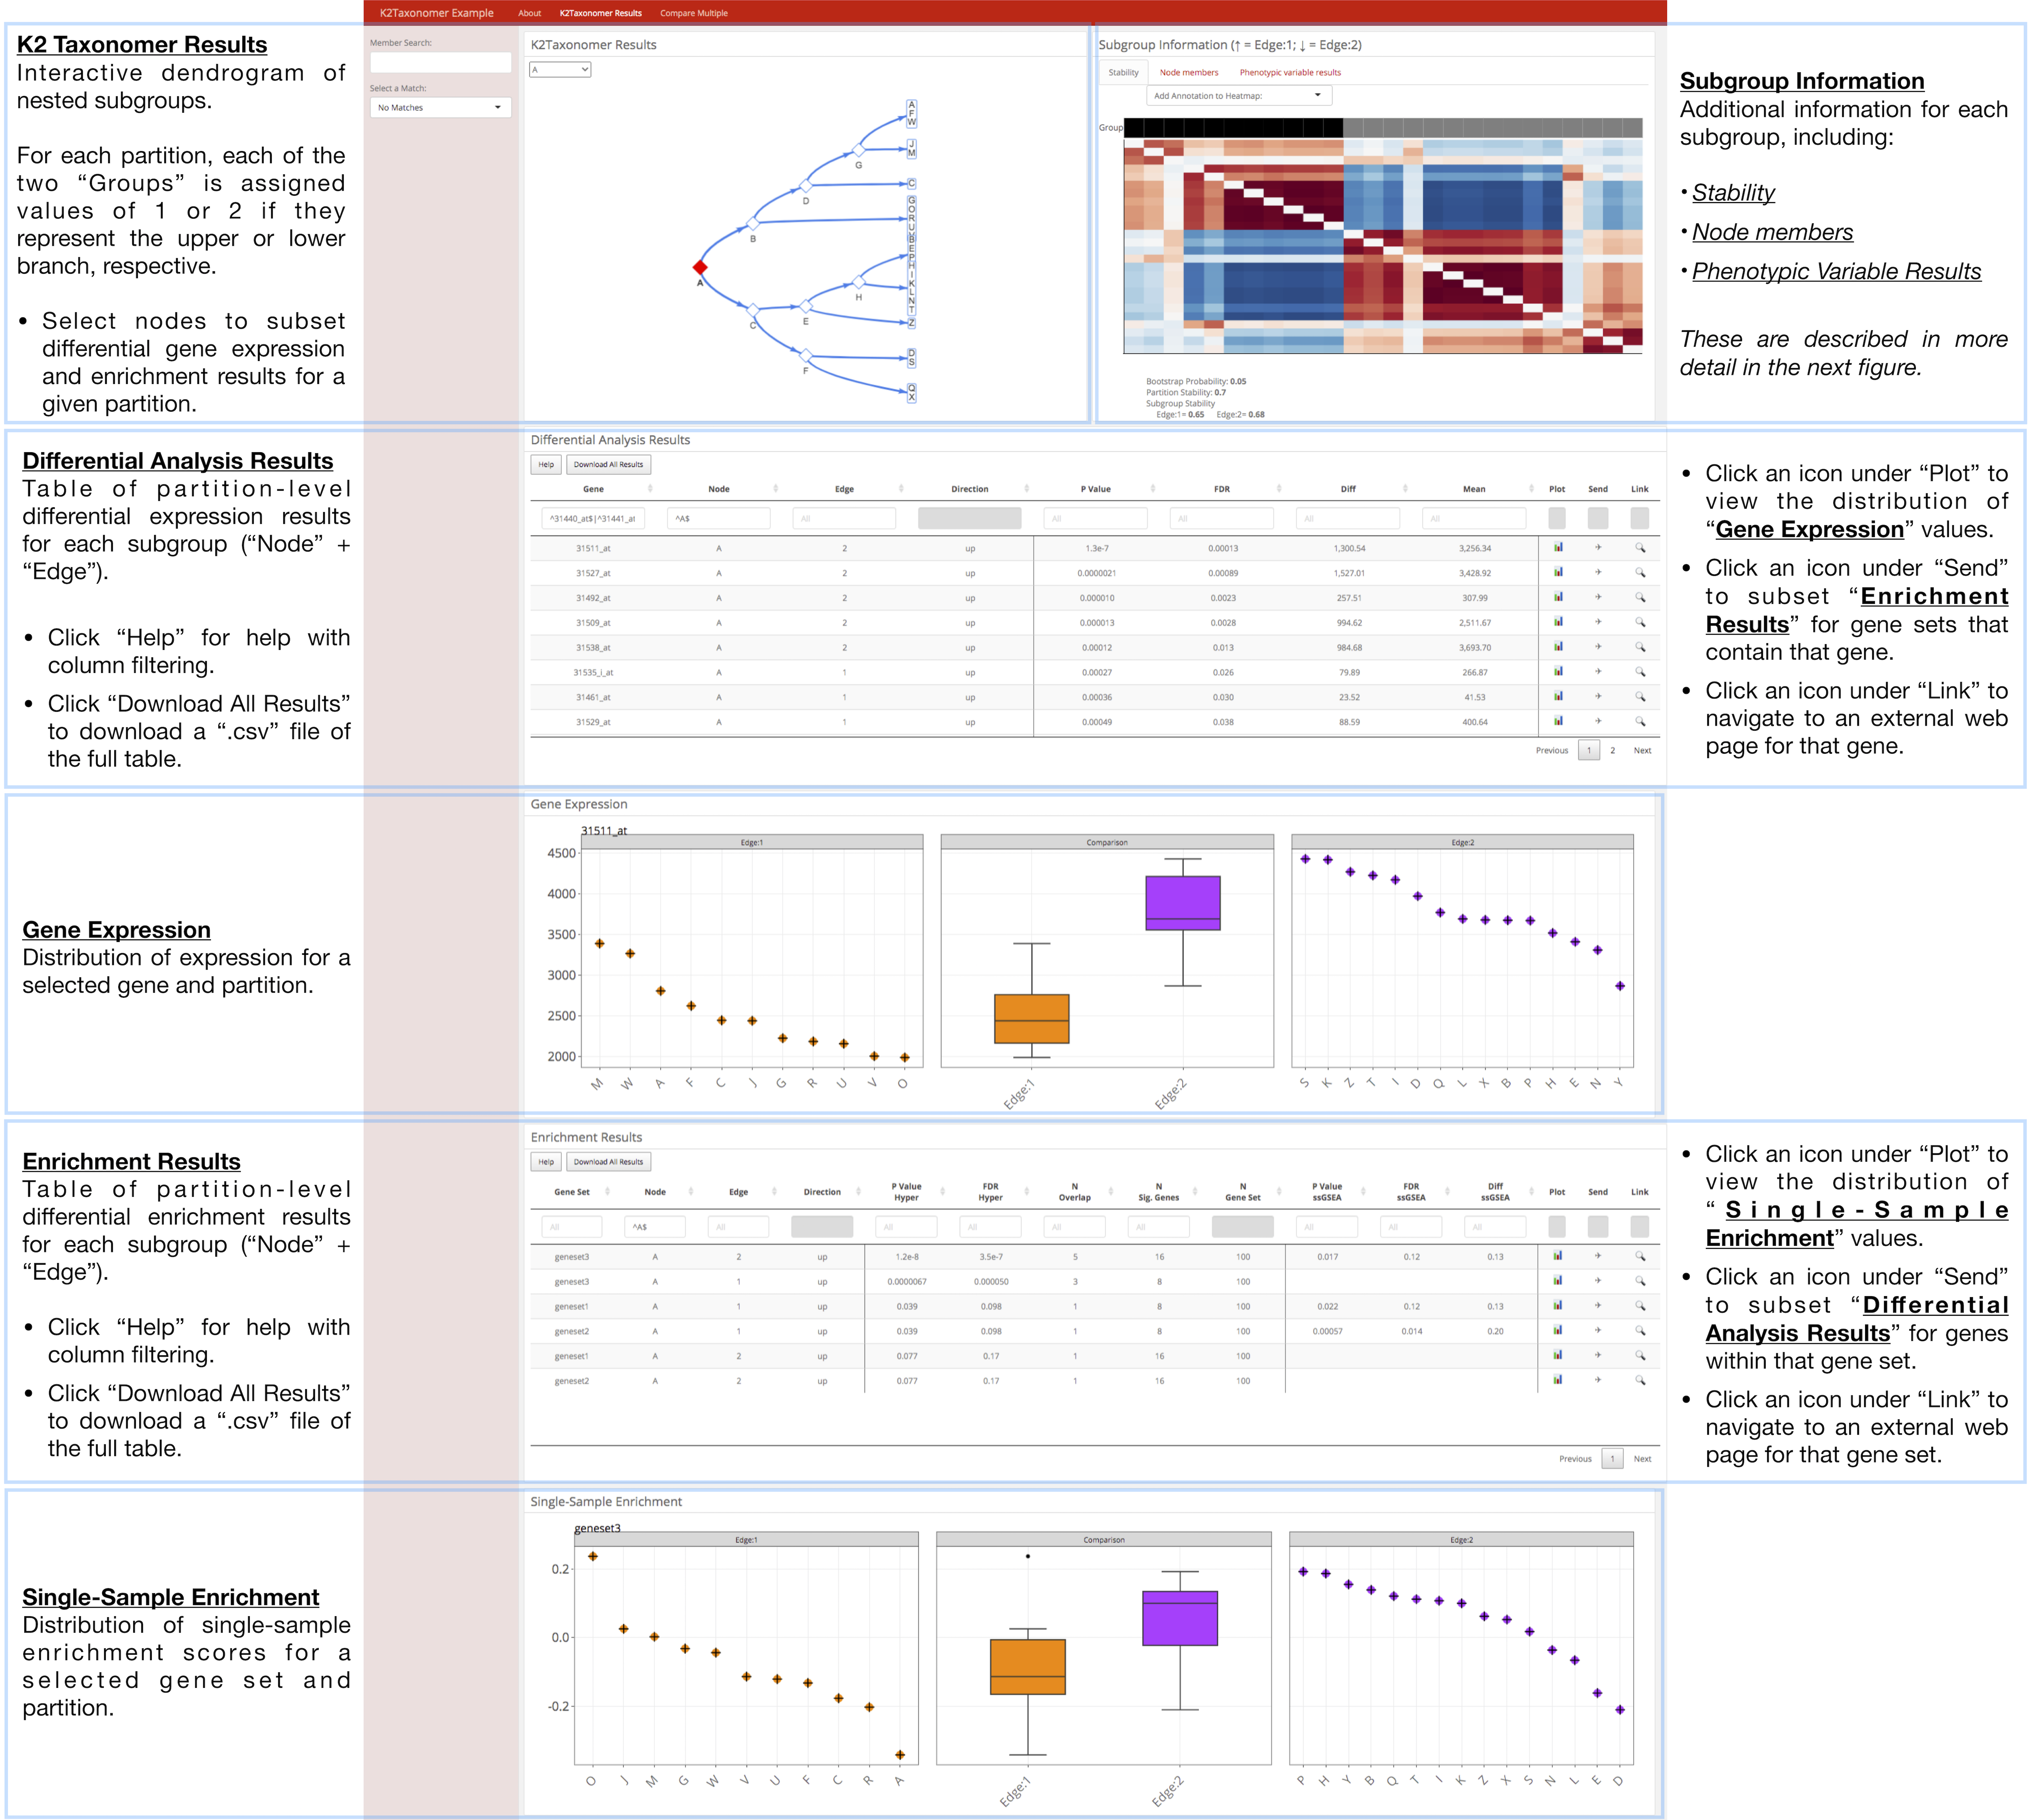
K2Taxonomer Results: This tab includes all of the results generated
throughout the r Githubpkg("montilab/K2Taxonomer") workflow, including:
partitioning results, partition stability, gene expression analysis,
gene set enrichment, and phenotypic variable testing (optional).
More information for how r Githubpkg("montilab/K2Taxonomer") estimates these
results can be found
here.
-
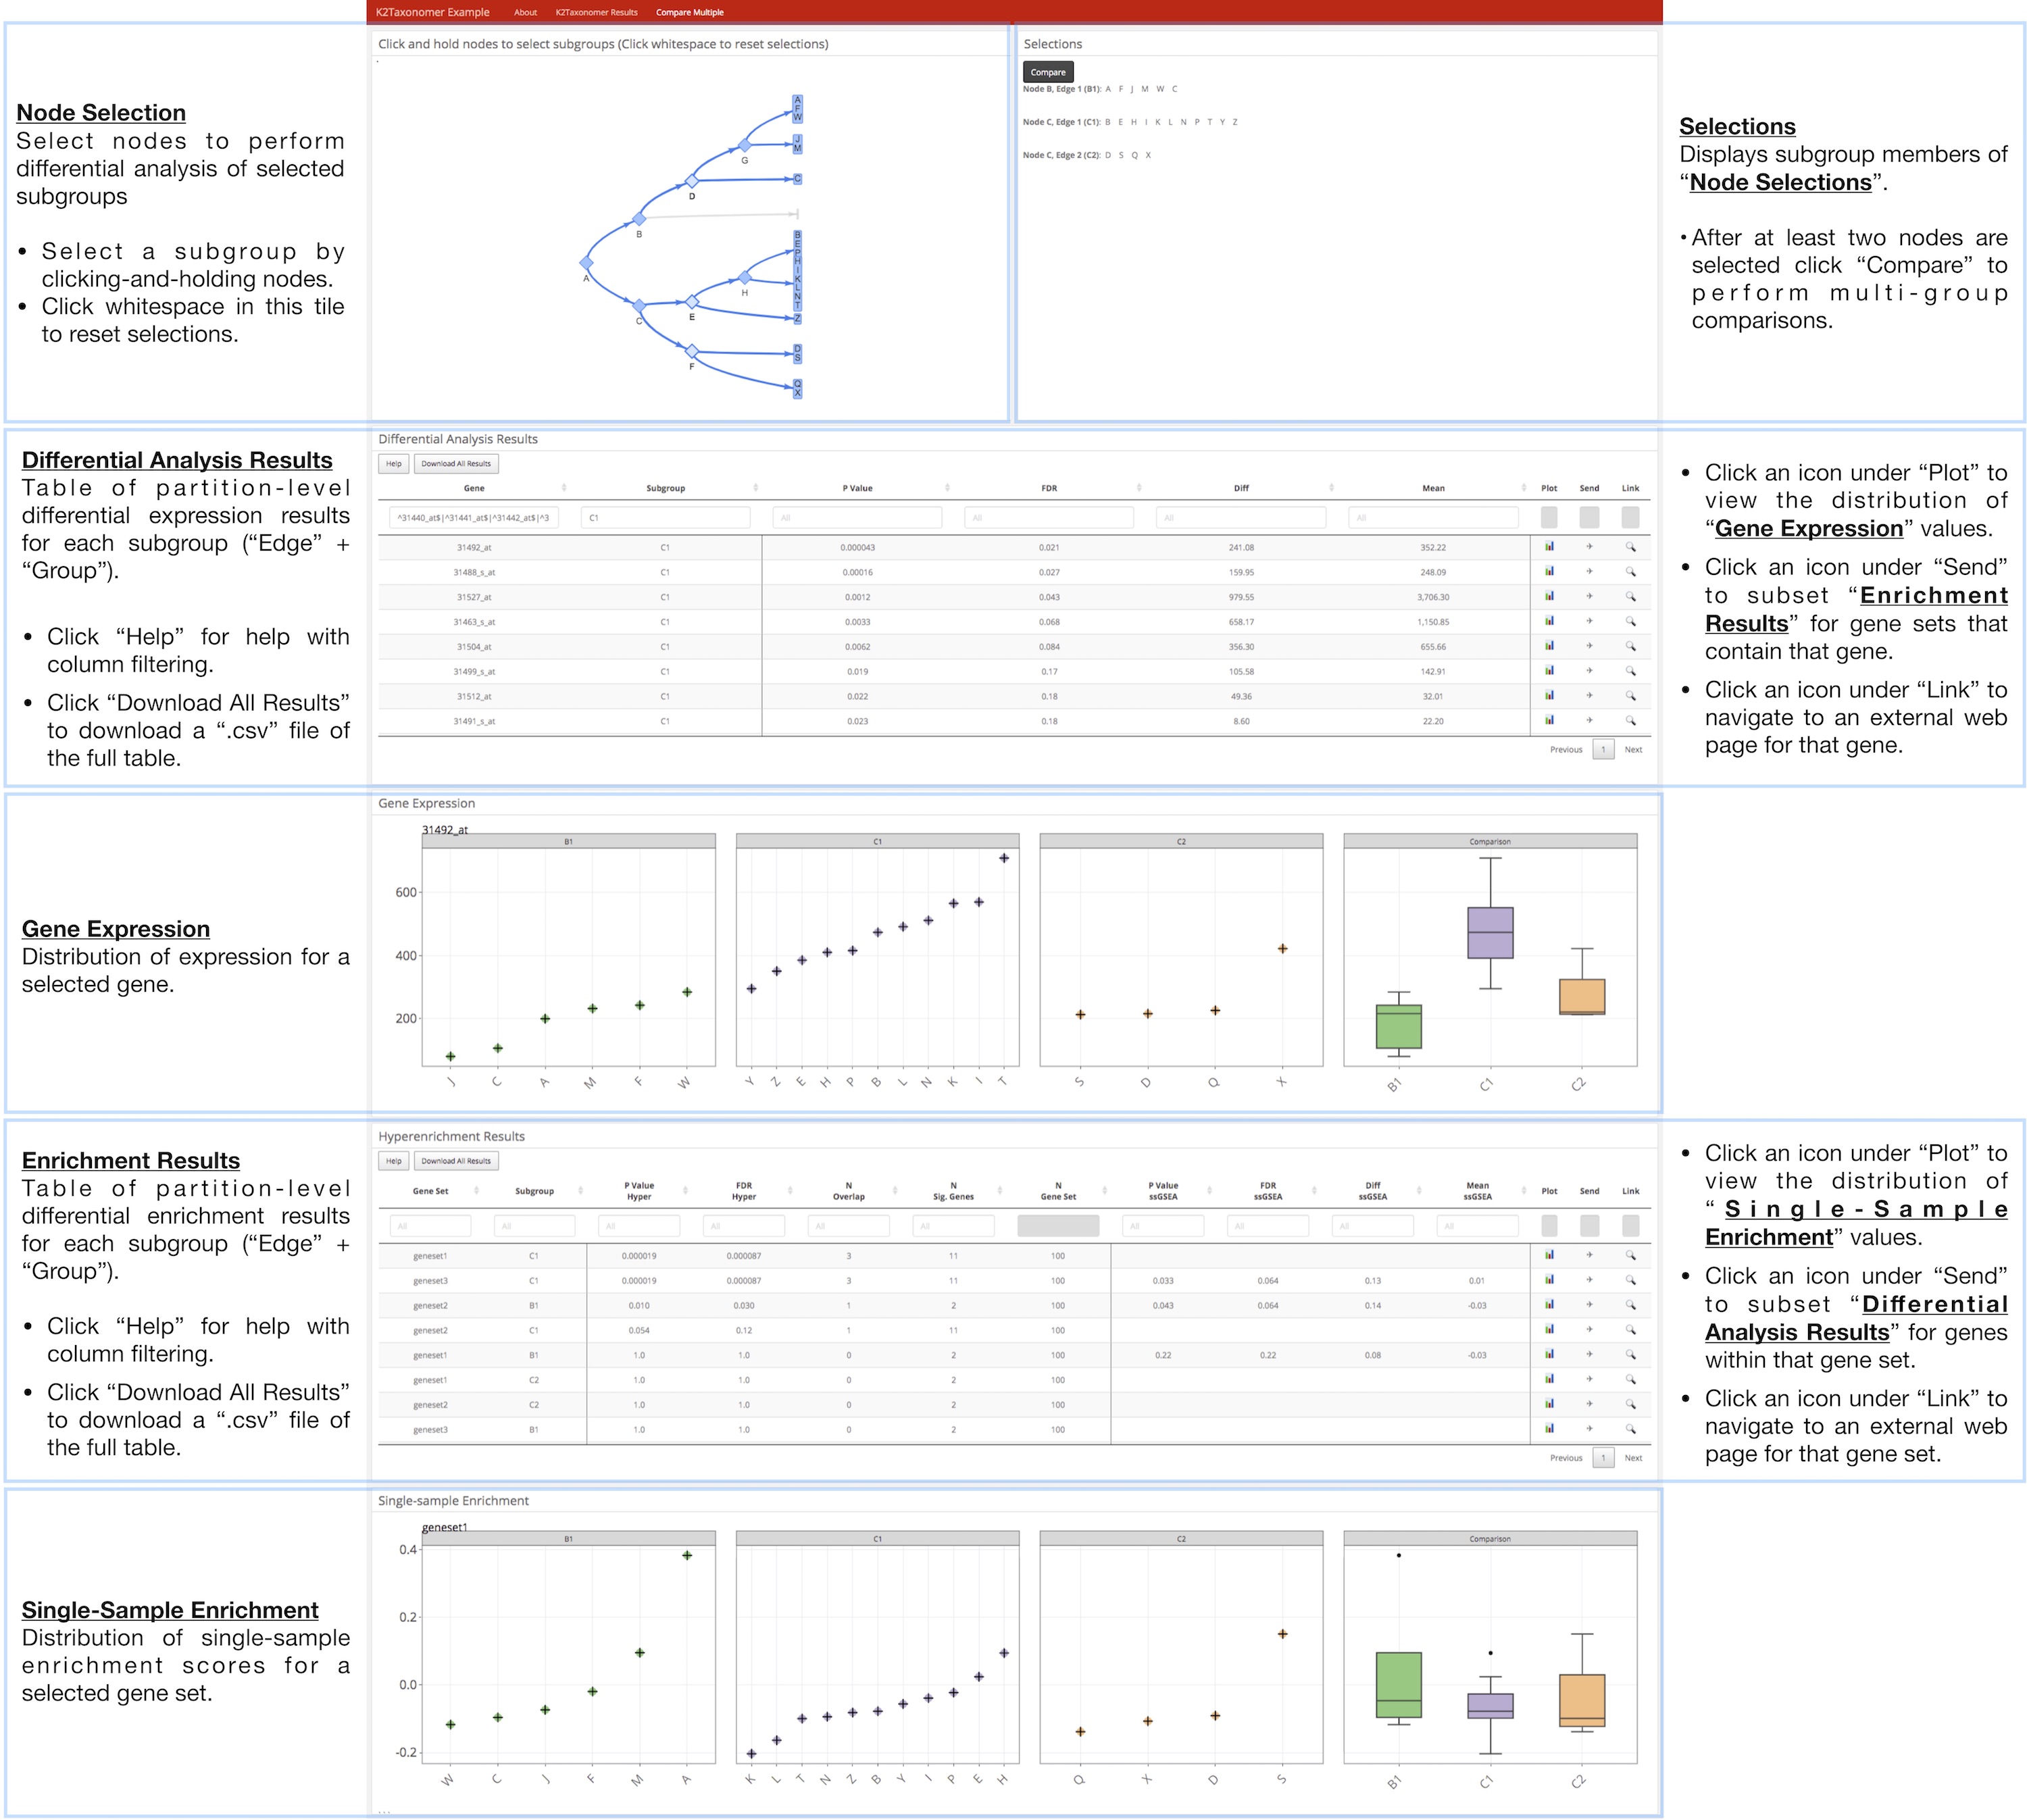
Compare Multiple: This tab allows the user to perform additional
molecular comparisons between subgroups, beyond the partition-level comparisons
performed by r Githubpkg("montilab/K2Taxonomer") functions.
Annotation of each of these tabs is presented below. Click on any of these
images to view in higher resolution
About
r Githubpkg("montilab/K2Taxonomer") Results
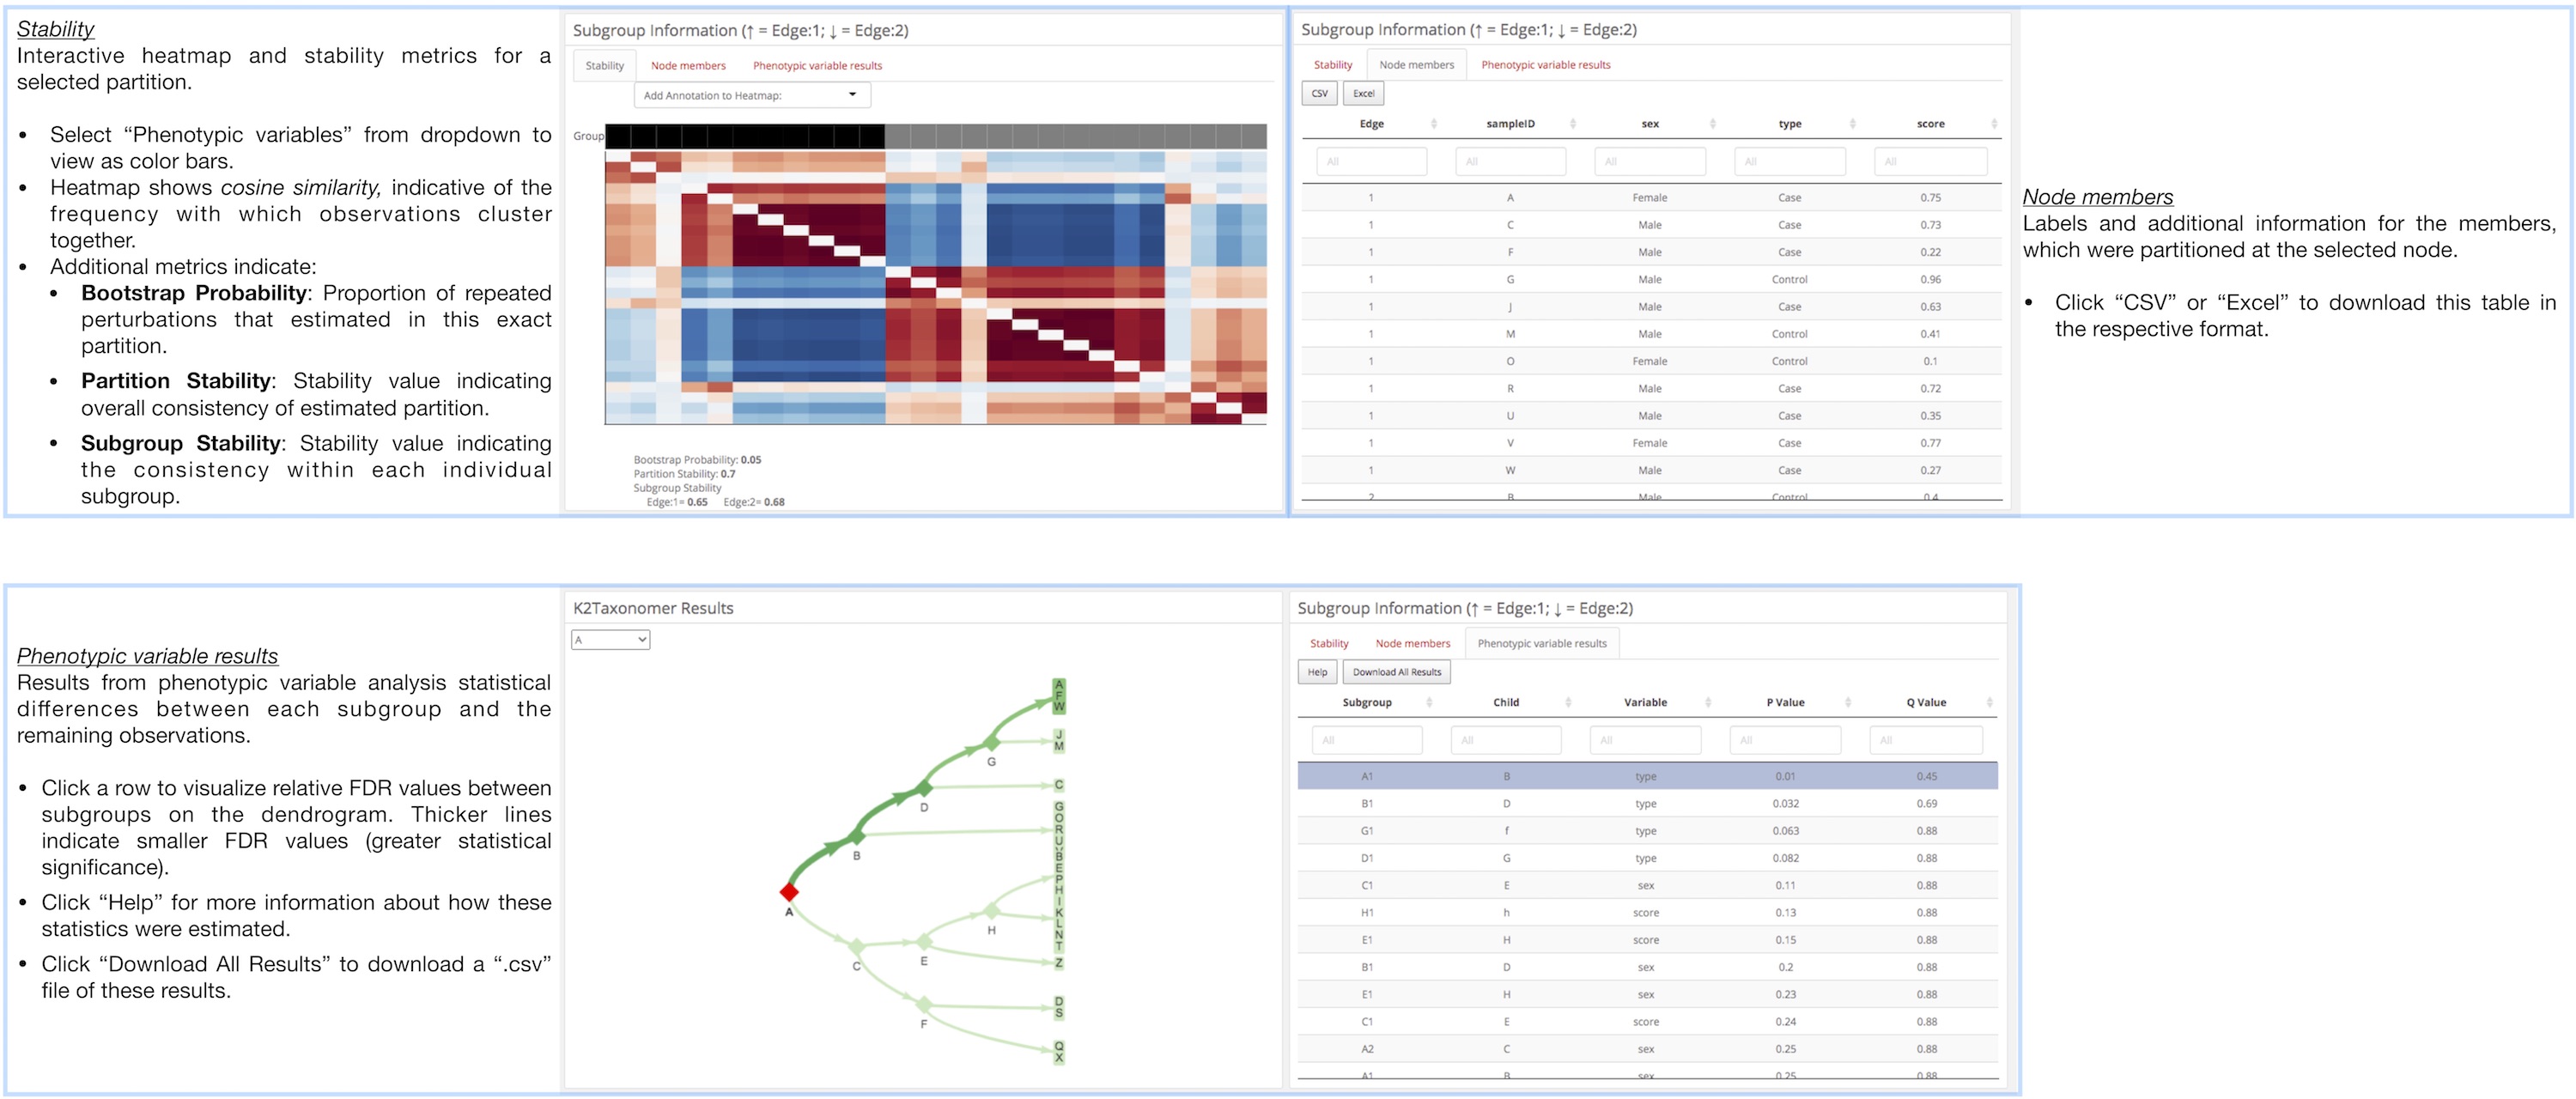
Subgroup Information
Compare Multiple
References
montilab/K2Taxonomer documentation built on Jan. 25, 2024, 4:29 p.m.
R Package Documentation
Browse R Packages
We want your feedback!
Note that we can't provide technical support on individual packages. You should contact the package authors for that.
knitr::opts_chunk$set( collapse=TRUE, comment="#>", message=FALSE, warning=FALSE )
Introduction
To facilitate the comprehensive interrogation the output of
r Githubpkg("montilab/K2Taxonomer") this package includes functionality for
generating interactive dashboards, which include full compendia of results
[@reed_2020]. In addition to the partition-level molecular comparisons included
in these dashboards, they include functionality for performing molecular
comparisons of gene expression and gene set enrichment on user-specified sets
of two-or-more subgroups. Here we describe the layout and usage of these
dashboards.
For more information for how to generate these dashboards go here.
The r Githubpkg("montilab/K2Taxonomer") dashboards include three tabs,
described below:
-
About: This is an optional tab with which the user can include information about the analysis being performed. This page is populated by a file, "about.md", included in the same directory as the dashboard file. More information about formatting this file can be found here.
-
K2Taxonomer Results: This tab includes all of the results generated throughout the
r Githubpkg("montilab/K2Taxonomer")workflow, including: partitioning results, partition stability, gene expression analysis, gene set enrichment, and phenotypic variable testing (optional). More information for howr Githubpkg("montilab/K2Taxonomer")estimates these results can be found here. -
Compare Multiple: This tab allows the user to perform additional molecular comparisons between subgroups, beyond the partition-level comparisons performed by
r Githubpkg("montilab/K2Taxonomer")functions.
Annotation of each of these tabs is presented below. Click on any of these images to view in higher resolution
About
r Githubpkg("montilab/K2Taxonomer") Results
Subgroup Information

Compare Multiple

References
R Package Documentation
Browse R Packages
We want your feedback!
Note that we can't provide technical support on individual packages. You should contact the package authors for that.
Embedding an R snippet on your website
Add the following code to your website.
For more information on customizing the embed code, read Embedding Snippets.