inst/shinyapp/helper/cross_gene.md
In UCSCXenaShiny: Interactive Analysis of UCSC Xena Data
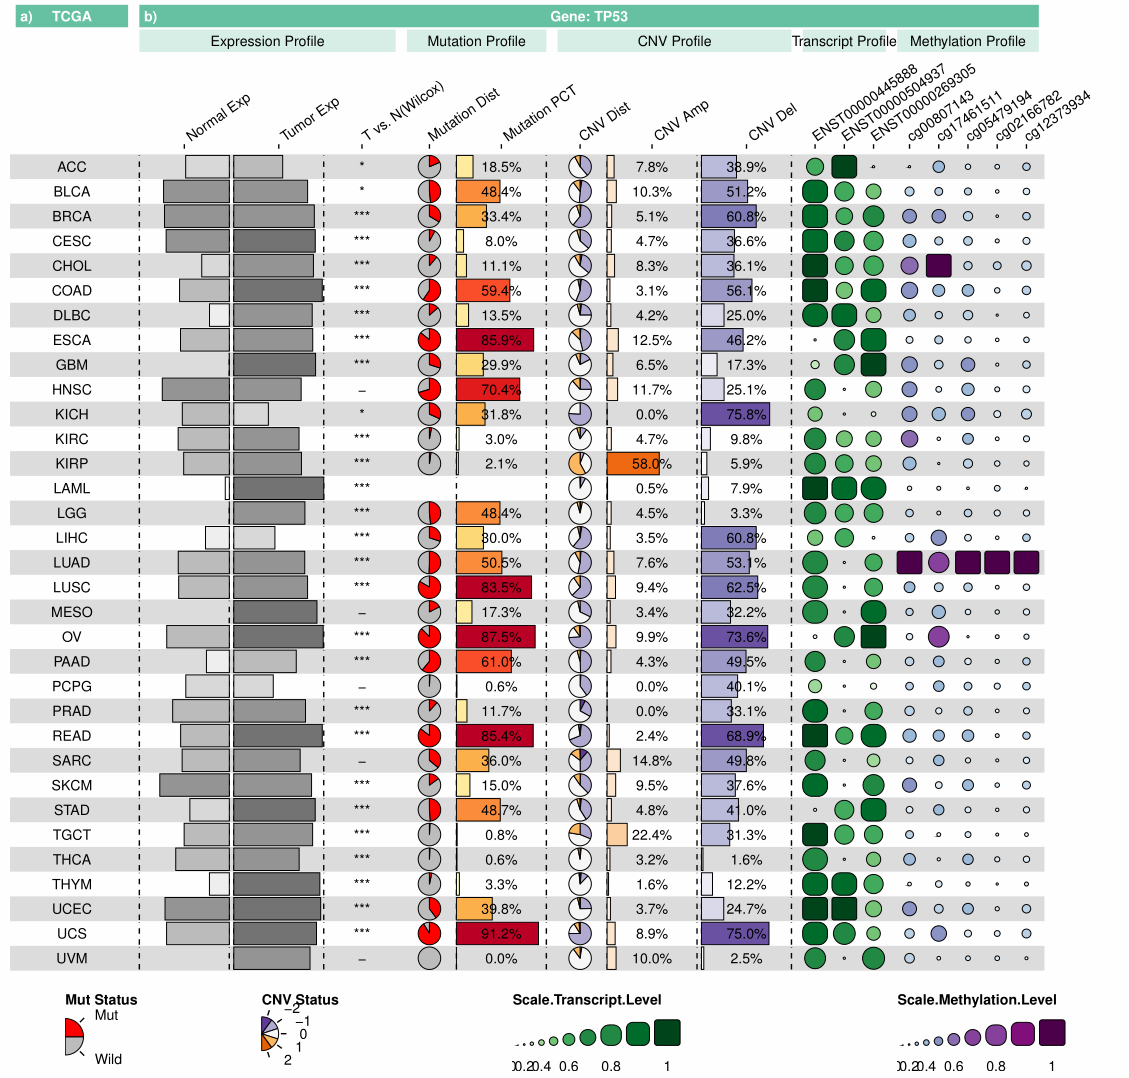
Visualize multi-omics profile of one gene among TCGA cancer types
1. Expression Profile
- Normal Exp : The median gene expression in normal tissues (Including GTEx samples).
- Tumor Exp : The median gene expression in tumor tissues.
- T vs. N(Wilcox): The Wilcoxon test between tumor and normal samples (P<0.001, "***"; P<0.01, "**"; P<0.05, "*"; P>0.05, "-").
Bar plot: The 0~1 normalization on TPM expression data.
2. Mutation Profile
-
Mutation Dist : The distribution of gene mutation or wild status in tumor tissues.
-
Mutation PCT : The percentage of gene mutation status in tumor tissues.
3. CNV Profile
-
CNV Dist : The distribution of gene copy number variation status in tumor tissues.
-
-2, homozygous deletion;
- -1, single copy deletion;
- 0, diploid normal copy;
- 1: low-level copy number amplification;
-
2: high-level copy number amplification
-
CNV Amp : The percentage of gene copy number amplification (1,2) in tumor tissues.
- CNV Del : The percentage of gene copy number deletion (-1, -2) in tumor tissues.
4. Transcript Profile
- Selected transcript(s) of one gene : The median transcript expression in tumor tissues.
5. Methylation Profile
- Selected CpG sites of one gene : The median beta value of CpG sites in tumor tissues.

Data source—
- mRNA: TcgaTargetGtex_rsem_gene_tpm
- Mutation: mc3.v0.2.8.PUBLIC.nonsilentGene.xena
- CNV: TCGA.PANCAN.sampleMap/Gistic2_CopyNumber_Gistic2_all_thresholded.by_genes
- Transcript: TcgaTargetGtex_rsem_isoform_tpm
- Methylation: GDC-PANCAN.methylation450.tsv
Try the UCSCXenaShiny package in your browser
Any scripts or data that you put into this service are public.
UCSCXenaShiny documentation built on Aug. 8, 2025, 7:19 p.m.
Visualize multi-omics profile of one gene among TCGA cancer types
1. Expression Profile
- Normal Exp : The median gene expression in normal tissues (Including GTEx samples).
- Tumor Exp : The median gene expression in tumor tissues.
- T vs. N(Wilcox): The Wilcoxon test between tumor and normal samples (P<0.001, "***"; P<0.01, "**"; P<0.05, "*"; P>0.05, "-").
Bar plot: The 0~1 normalization on TPM expression data.
2. Mutation Profile
-
Mutation Dist : The distribution of gene mutation or wild status in tumor tissues.
-
Mutation PCT : The percentage of gene mutation status in tumor tissues.
3. CNV Profile
-
CNV Dist : The distribution of gene copy number variation status in tumor tissues.
-
-2, homozygous deletion;
- -1, single copy deletion;
- 0, diploid normal copy;
- 1: low-level copy number amplification;
-
2: high-level copy number amplification
-
CNV Amp : The percentage of gene copy number amplification (1,2) in tumor tissues.
- CNV Del : The percentage of gene copy number deletion (-1, -2) in tumor tissues.
4. Transcript Profile
- Selected transcript(s) of one gene : The median transcript expression in tumor tissues.
5. Methylation Profile
- Selected CpG sites of one gene : The median beta value of CpG sites in tumor tissues.

Data source—
- mRNA: TcgaTargetGtex_rsem_gene_tpm
- Mutation: mc3.v0.2.8.PUBLIC.nonsilentGene.xena
- CNV: TCGA.PANCAN.sampleMap/Gistic2_CopyNumber_Gistic2_all_thresholded.by_genes
- Transcript: TcgaTargetGtex_rsem_isoform_tpm
- Methylation: GDC-PANCAN.methylation450.tsv
Try the UCSCXenaShiny package in your browser
Any scripts or data that you put into this service are public.
Add the following code to your website.
For more information on customizing the embed code, read Embedding Snippets.
