Nothing
inst/shinyapp/helper/cross_pw.md
In UCSCXenaShiny: Interactive Analysis of UCSC Xena Data
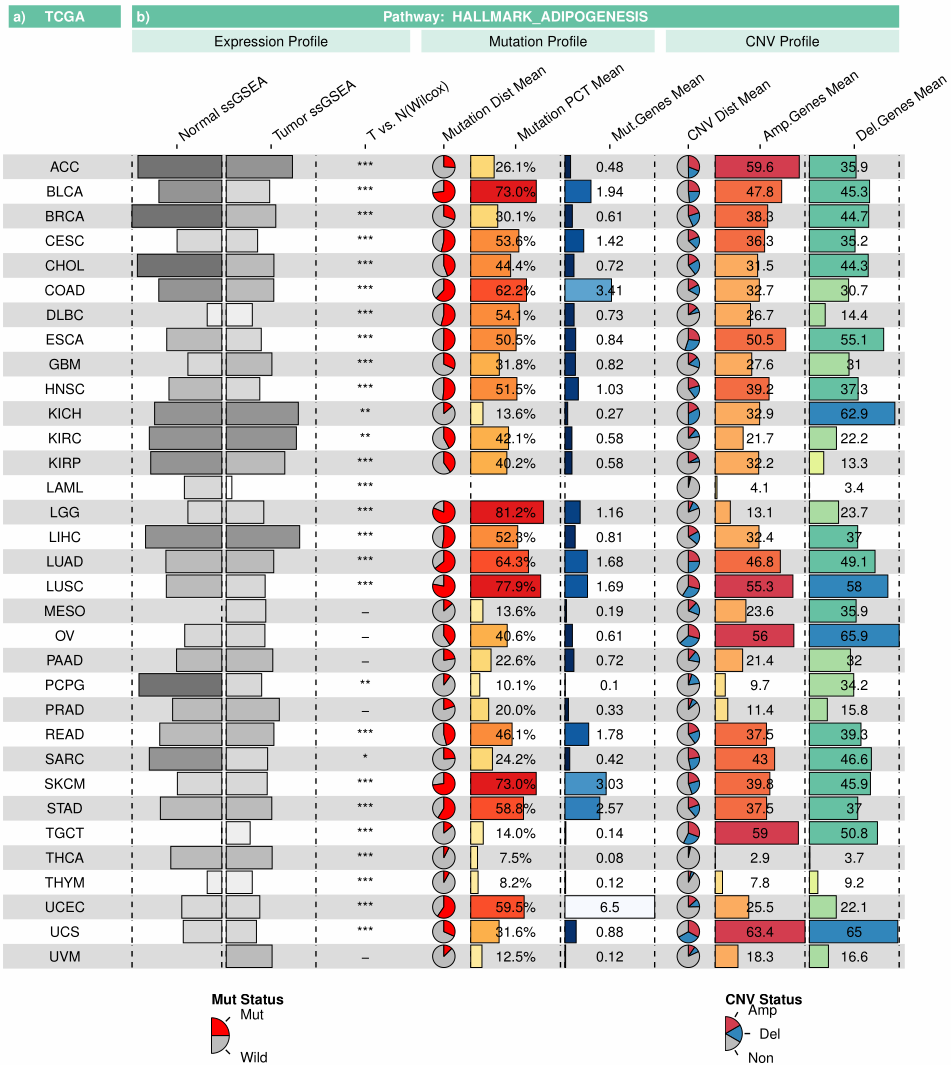
Visualize multi-omics profile of one pathway among TCGA cancer types
1. Expression Profile
- Normal ssGSEA : The median ssGSEA gene expression in normal tissues (Including GTEx samples).
- Tumor ssGSEA : The median ssGSEA gene expression in tumor tissues.
- T vs. N(Wilcox) : The Wilcoxon test between tumor and normal samples (P<0.001, "***"; P<0.01, "**"; P<0.05, "*"; P>0.05, "-").
Bar plot: The 0~1 normalization on TPM expression data.
2. Mutation Profile
-
Mutation Dist Mean: The distribution of mutation or wild pathway gene status in tumor tissues. If one of pathway genes is mutated, it is considered as mutation.
-
Mutation PCT Mean: The percentage of pathway mutation status in tumor tissues.
-
Mut.Genes Mean: The mean counts of mutated pathway genes in tumor tissues.
3. CNV Profile
- CNV Dist Mean: The distribution of pathway gene copy number variation status in tumor tissues.
- Amp, homozygous deletion or single copy deletion;
- Non, diploid normal copy;
-
Del, Copy number amplification.
-
Amp.Genes Mean : The copy number amplification percentage of pathway genes in tumor tissues.
- Del.Genes Mean : The copy number deletion percentage of pathway gene in tumor tissues.
Data source—
- mRNA: TcgaTargetGtex_rsem_gene_tpm
- Mutation: mc3.v0.2.8.PUBLIC.nonsilentGene.xena
- CNV: TCGA.PANCAN.sampleMap/Gistic2_CopyNumber_Gistic2_all_thresholded.by_genes
Try the UCSCXenaShiny package in your browser
Any scripts or data that you put into this service are public.
UCSCXenaShiny documentation built on Aug. 8, 2025, 7:19 p.m.
R Package Documentation
Browse R Packages
We want your feedback!
Note that we can't provide technical support on individual packages. You should contact the package authors for that.
Visualize multi-omics profile of one pathway among TCGA cancer types
1. Expression Profile
- Normal ssGSEA : The median ssGSEA gene expression in normal tissues (Including GTEx samples).
- Tumor ssGSEA : The median ssGSEA gene expression in tumor tissues.
- T vs. N(Wilcox) : The Wilcoxon test between tumor and normal samples (P<0.001, "***"; P<0.01, "**"; P<0.05, "*"; P>0.05, "-").
Bar plot: The 0~1 normalization on TPM expression data.
2. Mutation Profile
-
Mutation Dist Mean: The distribution of mutation or wild pathway gene status in tumor tissues. If one of pathway genes is mutated, it is considered as mutation.
-
Mutation PCT Mean: The percentage of pathway mutation status in tumor tissues.
-
Mut.Genes Mean: The mean counts of mutated pathway genes in tumor tissues.
3. CNV Profile
- CNV Dist Mean: The distribution of pathway gene copy number variation status in tumor tissues.
- Amp, homozygous deletion or single copy deletion;
- Non, diploid normal copy;
-
Del, Copy number amplification.
-
Amp.Genes Mean : The copy number amplification percentage of pathway genes in tumor tissues.
- Del.Genes Mean : The copy number deletion percentage of pathway gene in tumor tissues.
Data source—
- mRNA: TcgaTargetGtex_rsem_gene_tpm
- Mutation: mc3.v0.2.8.PUBLIC.nonsilentGene.xena
- CNV: TCGA.PANCAN.sampleMap/Gistic2_CopyNumber_Gistic2_all_thresholded.by_genes
Try the UCSCXenaShiny package in your browser
Any scripts or data that you put into this service are public.
R Package Documentation
Browse R Packages
We want your feedback!
Note that we can't provide technical support on individual packages. You should contact the package authors for that.
Embedding an R snippet on your website
Add the following code to your website.
For more information on customizing the embed code, read Embedding Snippets.