Nothing
inst/shinyapp/helper/analyze_comp_2.md
In UCSCXenaShiny: Interactive Analysis of UCSC Xena Data
- In S3 Step, comparison analysis across multiple cancers can now be performed after data preparation;
- Firstly, you can adjust the default analysis and visualization parameters, respectively;
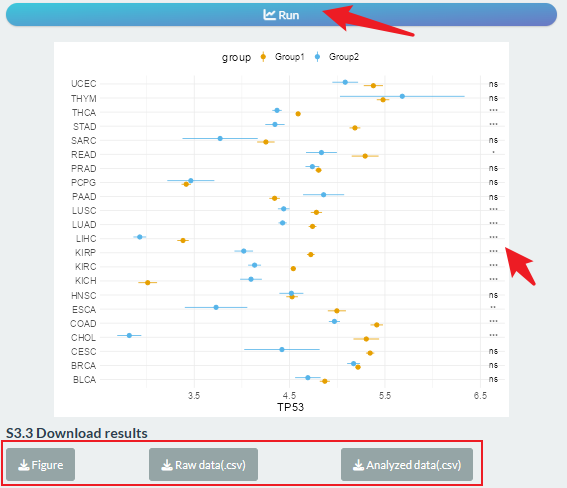
- Then, you will obtain the line plot labeled with statistical significance after clicking the "Run" button;
- Finally, you can download the 3 types of results.
- "Figure": visualization result;
- "Raw data(.csv)": queried data for comparison between groups;
- "Analyzed data(.csv)": detailed correlation result.
- See more details in UCSCXenaShiny v2 book site (todo list).
Try the UCSCXenaShiny package in your browser
Any scripts or data that you put into this service are public.
UCSCXenaShiny documentation built on May 29, 2024, 1:10 a.m.
R Package Documentation
Browse R Packages
We want your feedback!
Note that we can't provide technical support on individual packages. You should contact the package authors for that.
- In S3 Step, comparison analysis across multiple cancers can now be performed after data preparation;
- Firstly, you can adjust the default analysis and visualization parameters, respectively;
- Then, you will obtain the line plot labeled with statistical significance after clicking the "Run" button;
- Finally, you can download the 3 types of results.
- "Figure": visualization result;
- "Raw data(.csv)": queried data for comparison between groups;
- "Analyzed data(.csv)": detailed correlation result.
- See more details in UCSCXenaShiny v2 book site (todo list).
Try the UCSCXenaShiny package in your browser
Any scripts or data that you put into this service are public.
R Package Documentation
Browse R Packages
We want your feedback!
Note that we can't provide technical support on individual packages. You should contact the package authors for that.
Embedding an R snippet on your website
Add the following code to your website.
For more information on customizing the embed code, read Embedding Snippets.